• About
  • Elliott Waves
    • Elliott Waves Explained
    • Elliott Wave Magic Illustrated with Wave Charts
    • Elliott Wave Edge – How Elliott Wave Traders Win
    • Fibonacci Number Series and Elliott Waves
    • How to use Fibonacci Ratio Retracements
    • Elliott Wave Books
      • The Elliott Wave Book – Five Waves to Financial Freedom
      • Dividend Growth Investing Using Elliott Waves
    • Videos
  • Equities
    • Indices
      • Africa
        • Egypt
      • Australia
      • European Indices
        • AEX – Index, Amsterdam
        • DAX Index
        • Istanbul
        • Russia
        • Spain’s IBEX 35
      • Asian Indices
        • India
        • China
        • Dubai
        • Kuwait
        • Kuala Lumpur
        • Pakistan
        • Saudi
        • Taiwan
      • US Indices
        • S&P500
        • Nasdaq
        • Dow Jones
        • Dow Jones Utilities
    • Stocks
      • Asian Stocks
        • Indian Stocks Trading
        • Dubai Stocks Outlook
        • Japanese Stocks
        • Kuwait stocks
        • Saudi Stocks Outlook
      • African Stocks
        • Egyptian Stocks
      • Swiss Stocks
      • Australian Stocks
      • European Stocks
      • US Stocks outlook
      • UK Stocks
  • Commodities
    • Copper
    • Gasoline
    • Gold
    • Natural Gas
    • Oil
    • Palm Oil
    • Raw Sugar
    • Rubber
    • Soybean Oil
    • Silver
  • Forex
    • AUD
    • Bitcoin
    • CAD
    • CHF
    • Euro
    • GBP
    • INR
    • NZD
    • JPY
  • Raves
  • Consulting
    • Consulting
  • Ramki’s Watchlist
Top News

Has Meta (Facebook) stock seen the bottom

March 21, 2022

What Is The Nearest Technical Support For Meta (NASDAQ: FB)

February 7, 2022

Using Elliott Waves to Capture a Trade in S&P500

January 27, 2022
Facebook Twitter Instagram
WaveTimes Blog WaveTimes Blog
Wave times
  • About
  • Elliott Waves
    • Elliott Waves Explained
    • Elliott Wave Magic Illustrated with Wave Charts
    • Elliott Wave Edge – How Elliott Wave Traders Win
    • Fibonacci Number Series and Elliott Waves
    • How to use Fibonacci Ratio Retracements
    • Elliott Wave Books
      • The Elliott Wave Book – Five Waves to Financial Freedom
      • Dividend Growth Investing Using Elliott Waves
    • Videos
  • Equities
    • Indices
      • Africa
        • Egypt
      • Australia
      • European Indices
        • AEX – Index, Amsterdam
        • DAX Index
        • Istanbul
        • Russia
        • Spain’s IBEX 35
      • Asian Indices
        • India
        • China
        • Dubai
        • Kuwait
        • Kuala Lumpur
        • Pakistan
        • Saudi
        • Taiwan
      • US Indices
        • S&P500
        • Nasdaq
        • Dow Jones
        • Dow Jones Utilities
    • Stocks
      • Asian Stocks
        • Indian Stocks Trading
        • Dubai Stocks Outlook
        • Japanese Stocks
        • Kuwait stocks
        • Saudi Stocks Outlook
      • African Stocks
        • Egyptian Stocks
      • Swiss Stocks
      • Australian Stocks
      • European Stocks
      • US Stocks outlook
      • UK Stocks
  • Commodities
    • Copper
    • Gasoline
    • Gold
    • Natural Gas
    • Oil
    • Palm Oil
    • Raw Sugar
    • Rubber
    • Soybean Oil
    • Silver
  • Forex
    • AUD
    • Bitcoin
    • CAD
    • CHF
    • Euro
    • GBP
    • INR
    • NZD
    • JPY
  • Raves
  • Consulting
    • Consulting
  • Ramki’s Watchlist
WaveTimes Blog WaveTimes Blog
Home » A trade that didn’t work out as desired
Indian Stocks Trading

A trade that didn’t work out as desired

RamkiBy RamkiDecember 12, 20172 Comments3 Mins Read
Facebook Twitter LinkedIn Telegram Pinterest Tumblr Reddit WhatsApp Email
Share
Facebook Twitter LinkedIn Pinterest Email

As regular readers of this blog know, the posts here are meant to share with you some additional insights on how to use Elliott Wave Analysis in your trading and investment activity. It is a ‘living book’, an extension of ‘Five Waves to Financial freedom’. As part of this endeavor to share my knowledge and experience, I often post completed trades that members of our exclusive club participate in. A majority of those trades work out well. An occasional trade results  in a small loss, or we get out at a lower profit than desired. For the first time in 2017, we had a trade that did’t work out as well as we wanted it to. Let us see how we managed.

The stock in question was Steel Authority of India (SAIL). The trade was suggested on 6 November 2017 and a total of 60 charts were shared with the members before we finally closed the trade. Of course, I won’t be able to post all of them here. But here are the important ones.

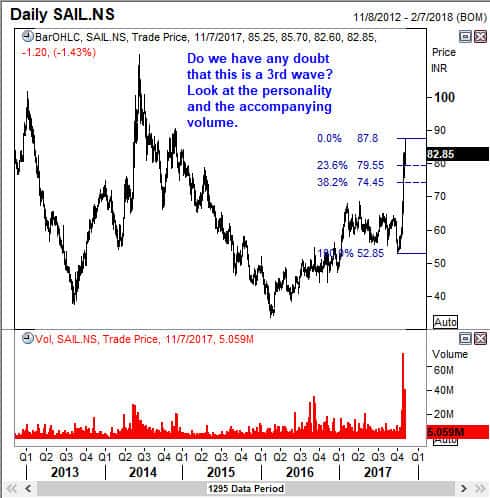
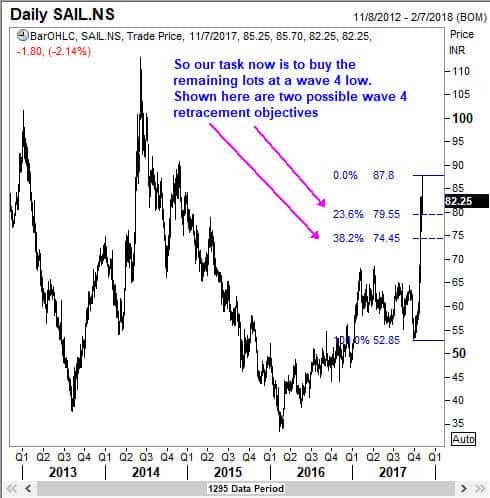
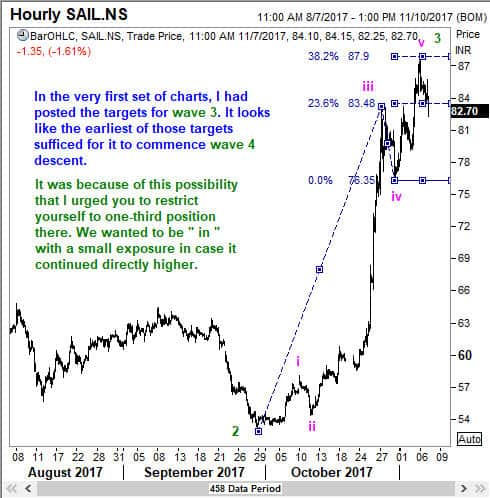
You can see that the stock had closed at 86.90 on Friday 3 November 2017. I suggested that SAIL was in the middle of a third wave, and given the momentum, we could potentially get to 94.95 and higher over the next several days. After all, when we are in a 3rd wave, we should have at least some exposure. Because wave 2 was short, I was hoping we will get an extended wave 3. The flip side is, if wave 3 finished early, we will get a deep wave 4.


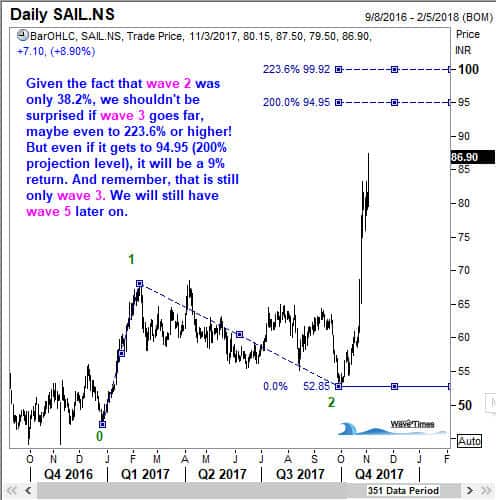
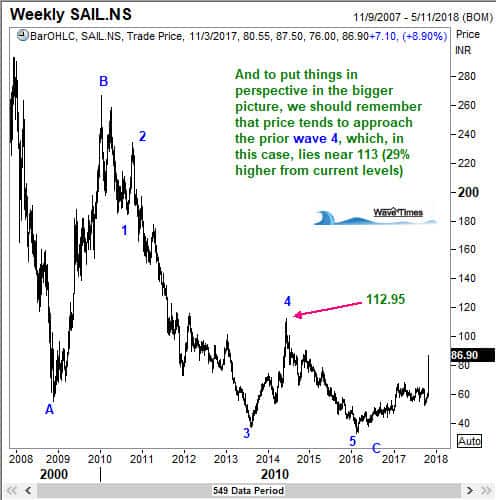
And we should never lose sight of the big picture!


7 November 2017 update


8 November 2017


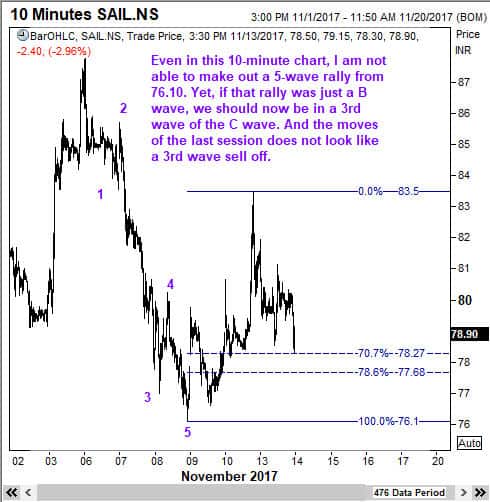
I had advised members to significantly lighten up their exposures on the next recovery so that they can manage this position without losing sleep. We saw a huge rally on 10th November to 83.50. After that the stock started coming off again. Now this is where members derived even more value. There was an UNMISTAKABLE pattern of a Head and Shoulders Top in the making. But see the chart below and the comments that went with it.


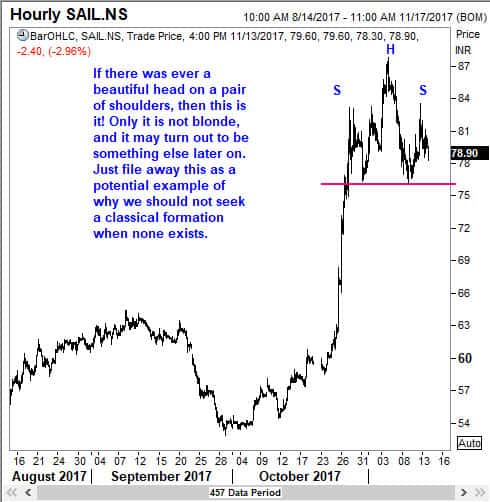
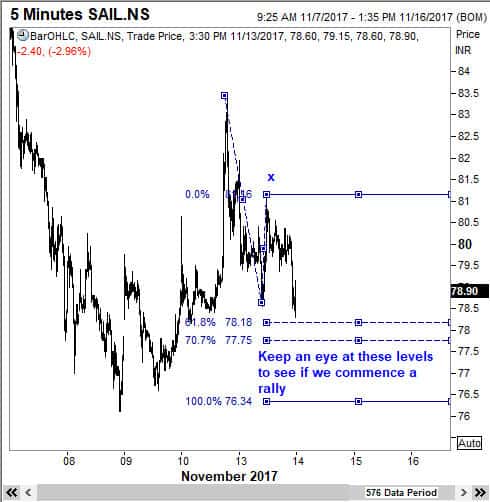
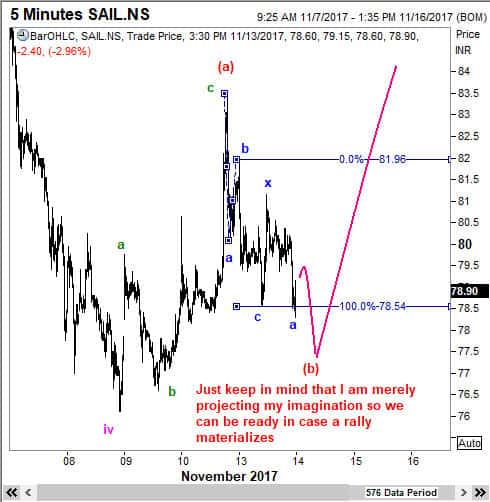
I also sent this update.

We made a low of 74.90 on 16 November, and on 21 November, the stock rallied to a high of 84.45.

We stayed with the trade until 8 December, during which time many members were trading in and out of the stock! I had advised that we should close the position if it gets above 82.80 and focus on something else. It opened at 82.95 on 8 December, and that was the high!

So, not all trades go up directly like it did for some of our other trades. But I do hope you enjoyed reading this, and benefited from a glimpse of how I operate in the market. It is never easy, especially if you get caught up in the midst of a complex correction. But if you have done your home work carefully, and if your position size is sensible, you can still emerge a winner (though on a smaller scale that originally planned).

My best wishes to all of you for a great holiday season ahead. Regards. Ramki.

Elliott Wave Analysis of SAIL
Share. Facebook Twitter Pinterest LinkedIn Tumblr Telegram Email
Previous ArticleElliott Wave Analysis of UCAL Fuel Systems Ltd
Next Article The Elliott Wave Edge for traders in Sangamo Therapeutics Inc
Ramki
  • Website

Related Posts

When Elliott Waves applauds the promoter’s signals!

January 3, 2022

A soft quarter for TCS – Avoid or Add – Contd.

October 13, 2021

A soft quarter for TCS — Avoid or add?

October 12, 2021
View 2 Comments

2 Comments

  1. Deep on December 13, 2017 12:14 pm

    SIR,

    Would it be convenient to share what website or software you use for your chart presentation. Thank you.

    Reply
    • Ramki Ramakrishnan on December 13, 2017 4:40 pm

      Deep, I use Thomson Reuters Eikon

      Reply

Leave A Reply Cancel Reply

Recent Posts
  • Has Meta (Facebook) stock seen the bottom
  • What Is The Nearest Technical Support For Meta (NASDAQ: FB)
  • Using Elliott Waves to Capture a Trade in S&P500
  • Hedge Funds and Elliott Waves – Netflix $NFLX
  • When Elliott Waves applauds the promoter’s signals!

WaveTimes is a Research Organization dedicated to providing original analysis, reports, reviews, and insights on developments in mutual funds, stocks, investing, foreign exchange, commodities, and bonds.

Contact WaveTimes

L-601 Mantri Espana,

Kariyammana Agrahara, Bellandur, Bangalore 560103

Follow Us

  • Facebook
  • YouTube
  • Twitter

© 2023 Wave Times. All Rights Reserved.
  • About
  • Books
  • Privacy Policy
  • Policies and Standards

Type above and press Enter to search. Press Esc to cancel.