I saw a catchy headline on Moneycontrol.com that read “A soft quarter for TCS — Avoid or add?” It has always been my recommendation that we should be guided by these kinds of interesting articles to the extent they draw our attention to something we might have missed! But beyond that, we should doour own analysis. Yes, our own Elliott Wave analysis!
How will you even start your Elliott Wave analysis of a stock such as TCS when it is close to its all-time high? Take a look at the daily chart shown below. What do you make out of it?
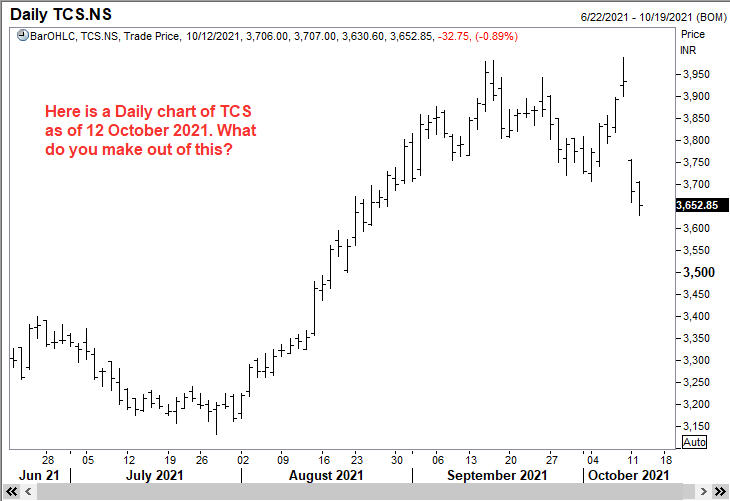
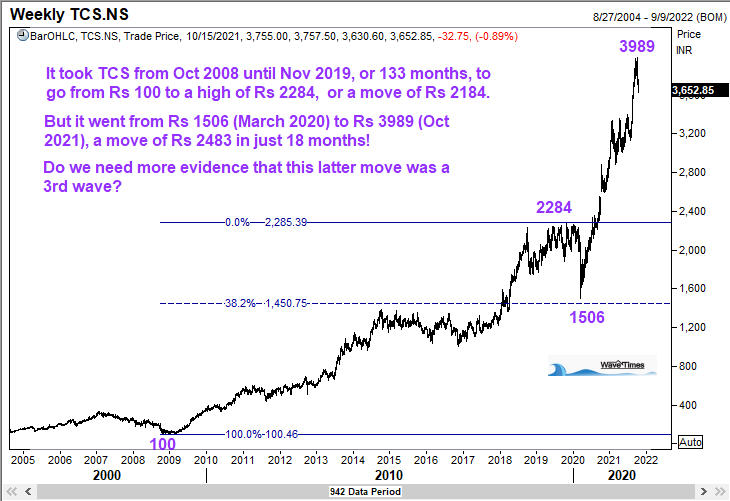
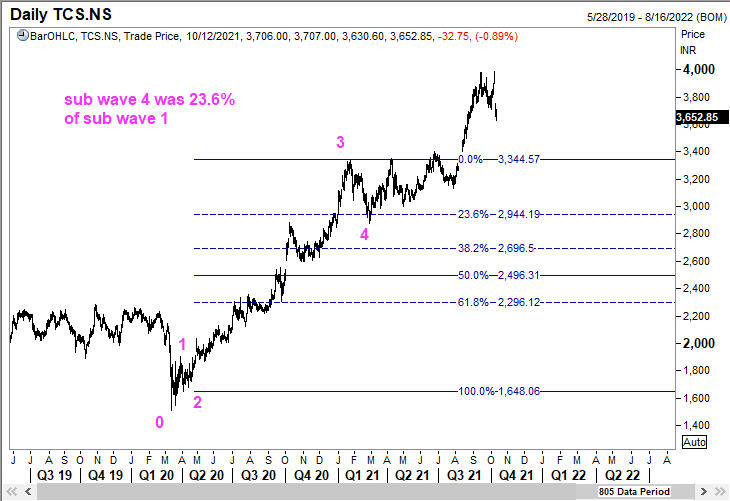
Not much, right? In order to make a proper assessment of where we are in the big cycle for TCS, we should look at the bigger picture. For example, we can go back to the Financial Crisis low of 2008 and see what has happened from that time. The TCS chart below does exactly that.
So we have a tentative idea of where in the Elliott Wave cycle we are for TCS. That makes it relatively easy to place the labels for wave 1 and wave 2. But ask yourself what your goals are? Are you doing this analysis to decide on a trade strategy for yourself, or do you want to showcase your ‘forecasting prowess’ to someone! My online Elliott Wave Course teaches you how to approach it with the former goal in mind. It gives you many angles to look at this picture. For example, do you know whether wave 3 is finished? And if it has ended, can we play from the short side? If we are only plannng to buy, where is a good level to enter? Where should we place a stop in case we decide to buy somewhere? How do we determine that stop loss level? When should we be aggressive and at what level will we know we are wrong?
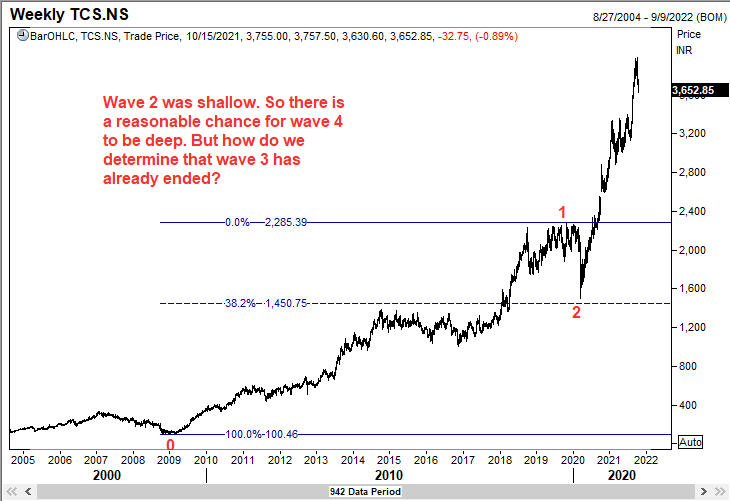
In the above chart, I have labelled wave 1 and wave 2. Easy enough, right? But what about wave 3? How do we determine if wave 3 has ended? To do that, we have to look closely at the sub waves of wave 3.
Some of you might be fussing about the sub wave 1 top. So let me show you a close-up view of sub wave 1 inside wave 3 in this TCS chart.
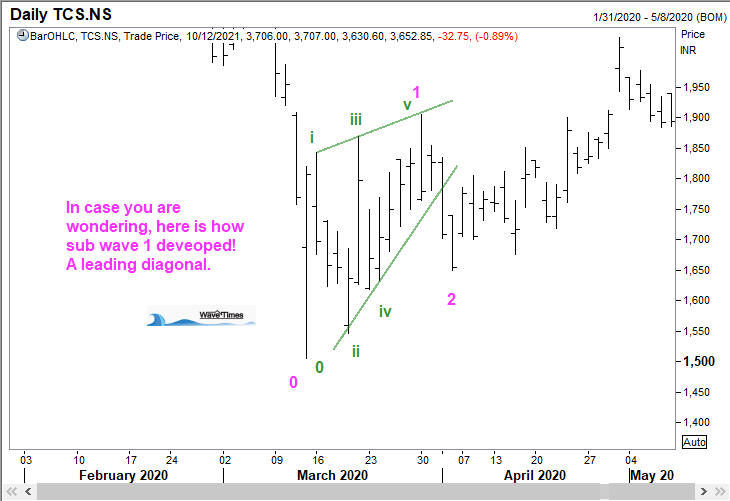
Next we check if sub wave 4 did anything ususual. Take a look at the next TCS chart where we see this correction has retraced to the 23.6% level.
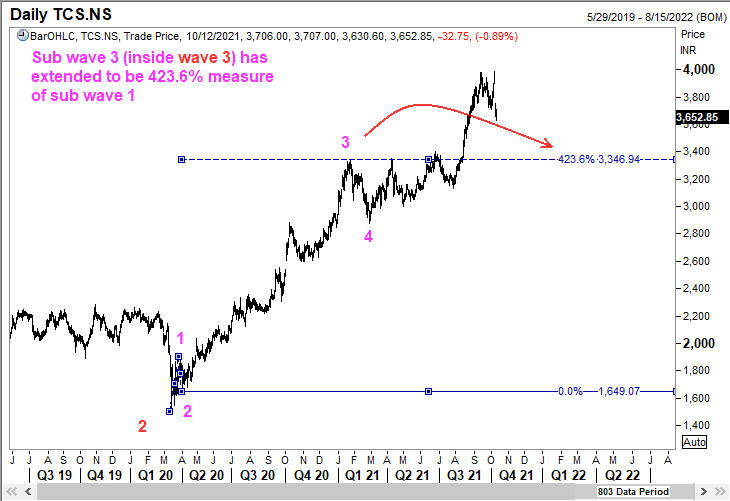
And now we project the possible targets for sub wave 5 of wave 3 and this is what we get for TCS.
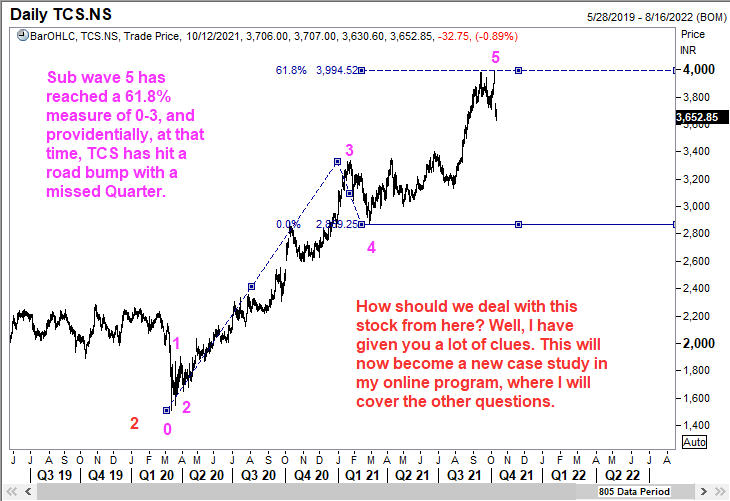
There are many nuances that need to be taken into account when it comes to trading a stock. A lot of people think that an ability to label the charts ( AFTER a move is over) gives them enormous power over the market. Let me assure you that nothing can be farther from the truth. You need to also learn how to USE these charts to start making money. Good luck!
