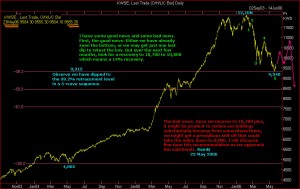
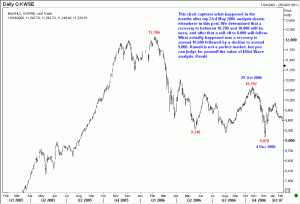
I use Elliott Wave analysis to give me an idea of where we are in an unfolding move, and also how far that move could go. If there is one important lesson I have learnt in using Wave Analysis, it is this: Your analysis could be the best in the world, but until the move happens, you are no better than anyone else out there. In other words, the best use you could put your analysis is to take the trade that is suggested, but be sure to have stops in place. If it works out, then you are a hero, because you got in at the best possible levels, and managed to stick with the move for longer than most others. If you get stopped, well, you paid a smaller price than most others. 
I would like you to consider the attached chart carefully. SNP500-3-apr-08. I had written this on 3rd April 2008 when the S&P was at 1367. This is a weekly chart (which is why the date on the chart shows the last day of the week). If you go to Yahoo-Finance and look up the daily chart of S&P today, you will observe that after spiking for one day to 1440 on 19th May, the index was sold down to 1201 on 15th July. Then we staged a recovery to 1312 on 8th November. From there, we have reached a low of 1097 till date. The objective mentioned on my analysis was 1060, just a few points away. Will we see a strong recovery from 1060 area? A bounce back to around 1110 is likely, but it is still too soon to think of buying. Be patient.

