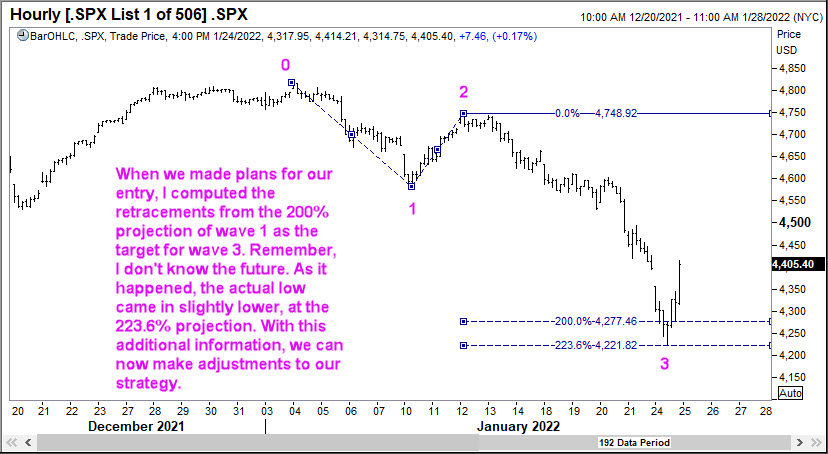
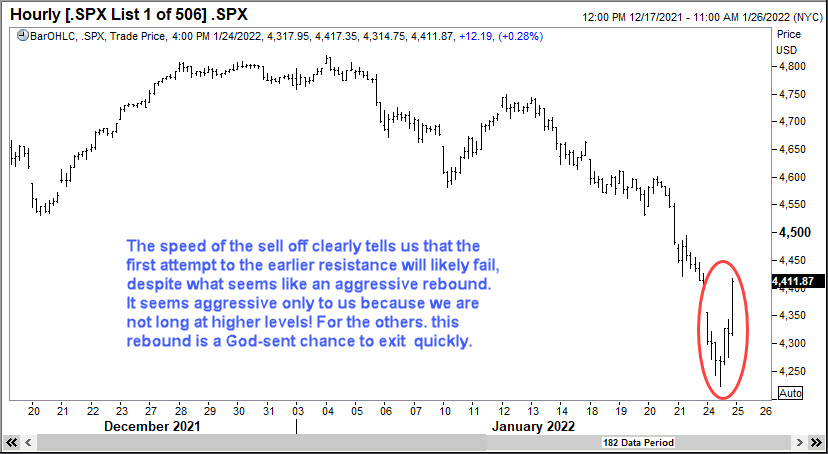
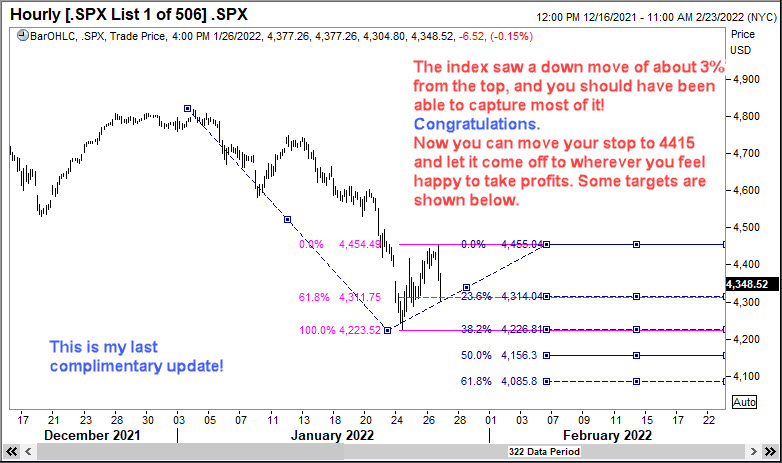
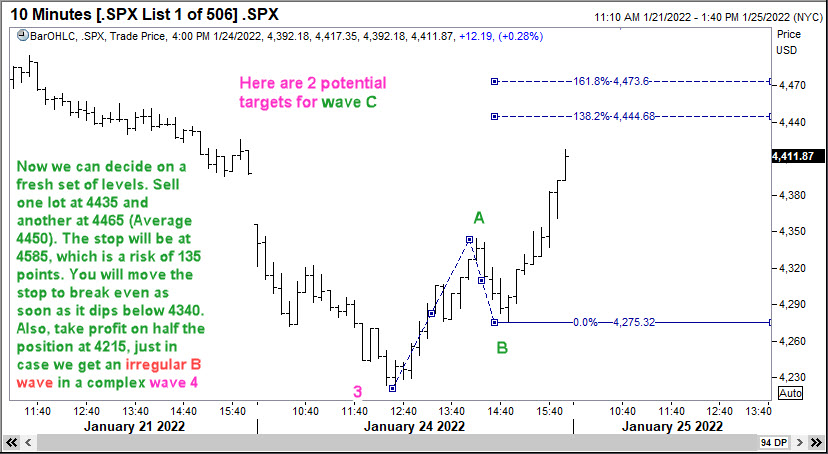
Elliott Waves enabled us to capture a nice little trade in S&P500 index in the last few days. On the 23rd of January, 2022, I emailed members of the WaveTimes exclusive club the following message “With the markets all jittery about the likely interest rate hikes this year in the US, everyone knows that stocks are going lower. One exception could be value stocks! But this email is about the S&P50 index. How far can this go, and how should we trade it from here? As you all know, my approach has got less to do with forecasting than finding a low-risk entry point, where the rewards give us outsized returns. With this in mind, I have prepared a set of charts that you can have…” In case you didn’t know, the exclusive club of WaveTimes seeks to educate experienced traders who undertand market risks about how to capture alpha using Elliott Waves. (It is not a service that offers investment advice, by the way). Many members wrote back immediately asking for the analysis, and I reproduce some of the Elliott Waves charts of the S&P500 index here for your learning.


Being aware of different possibilities in S&P500And finally, today, after the move to the downside commenced…

The key thing to note is we don’t know the future at any time. In the case of the S&P500 index, we used Elliott Waves to figure out what could be a reasonable low-risk level to trade. Of course, there are several other nuances that the other charts had, the things that I teach in my online Elliott Wave course available at https://elliottwaves.com. But suffice it to state here that if you learn the correct way to trade with Elliott Waves, you could take advantage of numerous opportunities that the markets present on a regular basis. There is really no need to be super-active to make money.
Announcement: The online Elliott Wave Course will go back to its full price on 1 February 2022!


