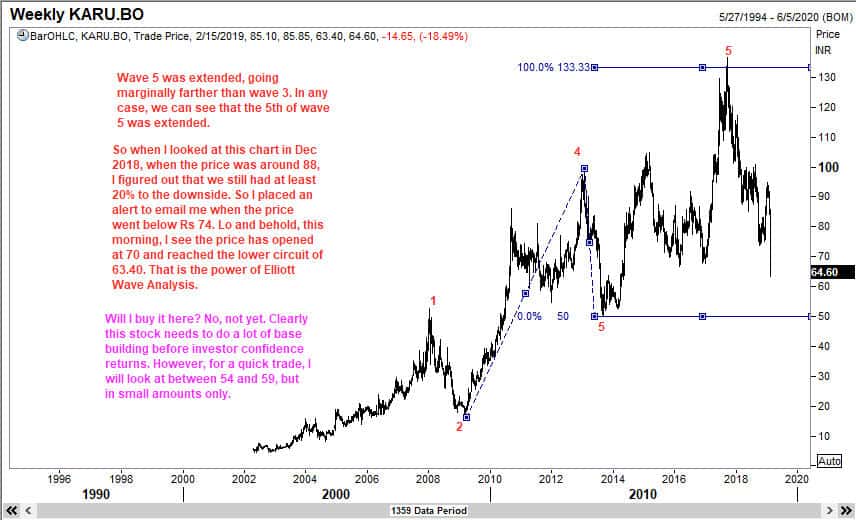
Every few days I am reminded of the power of Elliott Waves. Illustrated below is how I anticipated a down move of at least 20% in an Indian Stock.
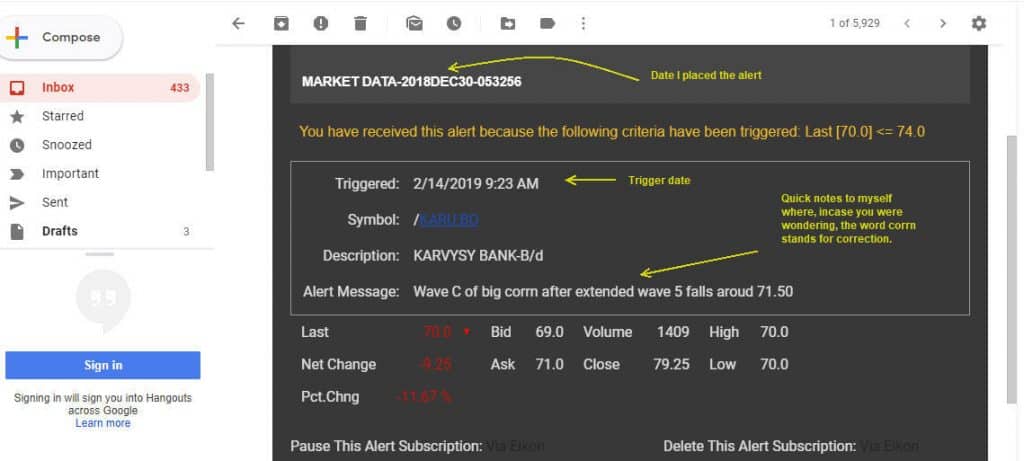
You would remember from my Elliott Wave book “Five Waves to Financial Freedom” that when a fifth wave extends, the correction that follows often tests the sub wave 2 with that fifth wave, and quite regularly goes even lower to reach the prior wave 4 low. On 30th December 2018, when I looked at Karur Vysya Bank stock for a client, I saw the portends of a further sell off. Already the stock had come down from its September 2017 high on 136.54 to around Rs 74 by October 2018, a move of over 45%. The recovery back to its then current levels of around Rs88 seemed part of a correction. So I placed an alert of my Thomson Reuters Eikon system to email me when the stock breaks its prior lows of Rs 74, so that I can evaluate how much lower the stock can go. See this email I received today.

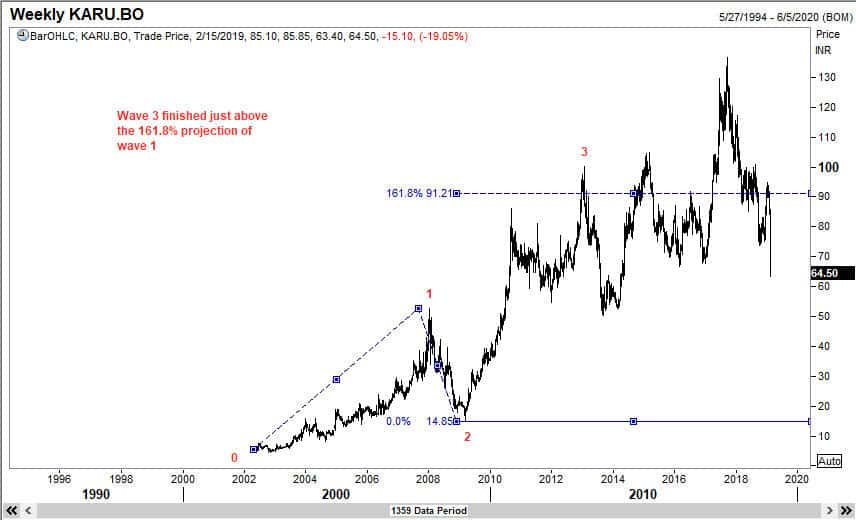
Below are a couple of more charts to help you see how I look at the waves!


