Elliott Wave analysis works in all freely traded markets. The last time I offered you my Elliott Wave analysis of Egypt’s equity index, EGX30, it was back in August 2012. You can access that blog post by looking at the menu at the top of WaveTimes, under ‘Equities, Index, Africa, Egypt’.
You will see how we identified that the Egyptian index was likely to make significant gains. At that time, the index was trading at 5049. A lot of water has since flown down the Nile, but the Egyptian stock market almost doubled. I am sure a lot of investors made handsome profits in individual stocks.
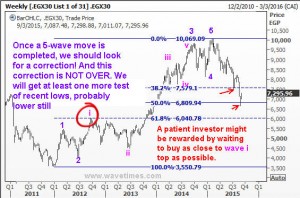
However, the inevitable Elliott Wave correction set in once the five wave cycle was completed. If you had read my book Elliott Wave book “Five Waves to Financial Freedom’ you will be able to spot how so many of the observations there has played out in the Egyptian Stock Index or EGX30 index.
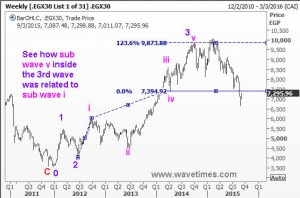
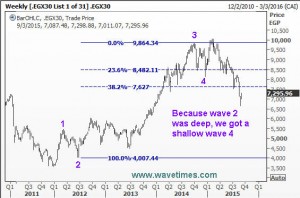
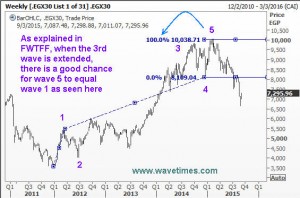
In the following Elliott Wave charts, I demonstrate some of the salient points. Remember that this blog exists as a resource for the student of Elliott Waves. Whether you are a professional trader, a casual investor or a serious student of Elliott Waves, the examples available here will fascinate you and help you better understand the nature of financial markets and how you could anticipate the market turns. So without any further ado, present you the charts of the Egyptian Stock market index and how Elliott Wave analysis was so powerful in its play.
Egypt’s stock index traced an extended third wave


Now that you have seen how Elliott Waves work, go back to FWTFF and try and see if you could figure out the likely ending point of the on going correction. Good luck.


