Today’s FT carries an interesting report filed by Miles Johnson, their Hedge Fund Correspondent. This report says that Seth Klarman, one of the most respected investors, has raised the alarm over a looming asset price bubble, and specifically mentions Tesla Motors , (TSLA:NSQ). He has warned of the potential for a brutal correction across financial markets. See this link: Seth Klarman warns of asset price bubble
So I decided to check out the charts for Tesla Motors to see if Elliott Waves could offer us additional clues that might help us play along with the view professed by Mr Klarman.
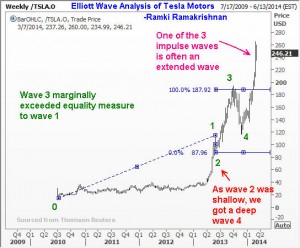
Take a look at the first chart below. It clearly shows that we are in the fifth wave of a move that stated back in Q3 of 2010. According to the Elliott Wave Principle, it is normal for one of the three impulse waves within a five wave sequence to be extended, i.e. for it to move a greater distance than the other two impulse waves. The chart below shows that the first and third waves were roughly equal is measure (i.e. they were of ‘normal’ proportions). This also ties in with another feature of Elliott’s observations that often enough, two impulse waves tend to be equal in dimensions. You will also observe the principle of alternation in the two corrective waves seen, whereby when wave 2 was shallow, we got a wave 4 that was deep.
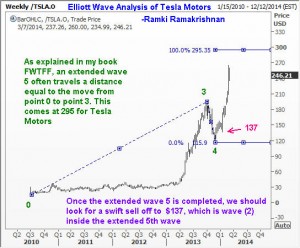
The next chart shows how to anticipate a possible end point for wave 5. Because we are expecting wave 5 to be extended, one possible terminal point is at a place where wave 5 would have traveled a distance equal to that from point 0 to point 3. This comes at $295.
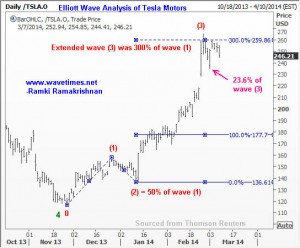
We will now zoom in to the fifth wave and see if the sub waves of the fifth wave can give us additional information. As you probably know, every impulse wave is composed of its own set of five sub waves. We can immediately see that sub wave (3) was extended to reach about 300% of sub wave (1). Wave (2) was 50% of wave (1) and wave (4) has already corrected to a 23.6% measure of wave (3). All these Fibonacci Ratios are common measures used by Elliott Wave Analysts to add confidence to their reading of the waves.
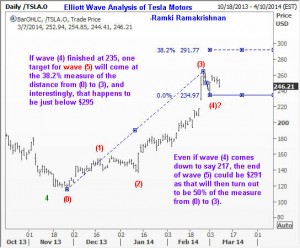
The final chart below uses the technique I have described in my book “Five Waves to Financial Freedom” where we measure the distance form point (0) to point (3) and compute a 38.2% and a 50% measure. These measures, when added to the bottom of wave (4) will give us potential targets for wave (5). Interestingly, if we add a 38.2% measure to wave (4) at 235, the target comes just below $295 which we already saw earlier. And should wave (4) come down some more to reach a 38.2% correction of wave (3) – that is reach $217, then we will get wave (5) to land at 291 if we add a 50% measure of (0) to (3).
Because of these confluences, we should go with the belief that there is a high probability for Tesla Motors to complete its extended fifth wave just below $295 and commence a very sharp decline that can take it all the way down to $137. This is the level where the extended fifth wave had its sub wave (2) end. There are numerous illustrations of this phenomenon explained in this blog as well as in my book so much so that I have often informed readers that fifth wave extensions can make us rich! Good luck and happy hunting.


