• About
  • Elliott Waves
    • Elliott Waves Explained
    • Elliott Wave Magic Illustrated with Wave Charts
    • Elliott Wave Edge – How Elliott Wave Traders Win
    • Fibonacci Number Series and Elliott Waves
    • How to use Fibonacci Ratio Retracements
    • Elliott Wave Books
      • The Elliott Wave Book – Five Waves to Financial Freedom
      • Dividend Growth Investing Using Elliott Waves
    • Videos
  • Equities
    • Indices
      • Africa
        • Egypt
      • Australia
      • European Indices
        • AEX – Index, Amsterdam
        • DAX Index
        • Istanbul
        • Russia
        • Spain’s IBEX 35
      • Asian Indices
        • India
        • China
        • Dubai
        • Kuwait
        • Kuala Lumpur
        • Pakistan
        • Saudi
        • Taiwan
      • US Indices
        • S&P500
        • Nasdaq
        • Dow Jones
        • Dow Jones Utilities
    • Stocks
      • Asian Stocks
        • Indian Stocks Trading
        • Dubai Stocks Outlook
        • Japanese Stocks
        • Kuwait stocks
        • Saudi Stocks Outlook
      • African Stocks
        • Egyptian Stocks
      • Swiss Stocks
      • Australian Stocks
      • European Stocks
      • US Stocks outlook
      • UK Stocks
  • Commodities
    • Copper
    • Gasoline
    • Gold
    • Natural Gas
    • Oil
    • Palm Oil
    • Raw Sugar
    • Rubber
    • Soybean Oil
    • Silver
  • Forex
    • AUD
    • Bitcoin
    • CAD
    • CHF
    • Euro
    • GBP
    • INR
    • NZD
    • JPY
  • Raves
  • Consulting
    • Consulting
  • Ramki’s Watchlist
Top News

Has Meta (Facebook) stock seen the bottom

March 21, 2022

What Is The Nearest Technical Support For Meta (NASDAQ: FB)

February 7, 2022

Using Elliott Waves to Capture a Trade in S&P500

January 27, 2022
Facebook Twitter Instagram
WaveTimes Blog WaveTimes Blog
Wave times
  • About
  • Elliott Waves
    • Elliott Waves Explained
    • Elliott Wave Magic Illustrated with Wave Charts
    • Elliott Wave Edge – How Elliott Wave Traders Win
    • Fibonacci Number Series and Elliott Waves
    • How to use Fibonacci Ratio Retracements
    • Elliott Wave Books
      • The Elliott Wave Book – Five Waves to Financial Freedom
      • Dividend Growth Investing Using Elliott Waves
    • Videos
  • Equities
    • Indices
      • Africa
        • Egypt
      • Australia
      • European Indices
        • AEX – Index, Amsterdam
        • DAX Index
        • Istanbul
        • Russia
        • Spain’s IBEX 35
      • Asian Indices
        • India
        • China
        • Dubai
        • Kuwait
        • Kuala Lumpur
        • Pakistan
        • Saudi
        • Taiwan
      • US Indices
        • S&P500
        • Nasdaq
        • Dow Jones
        • Dow Jones Utilities
    • Stocks
      • Asian Stocks
        • Indian Stocks Trading
        • Dubai Stocks Outlook
        • Japanese Stocks
        • Kuwait stocks
        • Saudi Stocks Outlook
      • African Stocks
        • Egyptian Stocks
      • Swiss Stocks
      • Australian Stocks
      • European Stocks
      • US Stocks outlook
      • UK Stocks
  • Commodities
    • Copper
    • Gasoline
    • Gold
    • Natural Gas
    • Oil
    • Palm Oil
    • Raw Sugar
    • Rubber
    • Soybean Oil
    • Silver
  • Forex
    • AUD
    • Bitcoin
    • CAD
    • CHF
    • Euro
    • GBP
    • INR
    • NZD
    • JPY
  • Raves
  • Consulting
    • Consulting
  • Ramki’s Watchlist
WaveTimes Blog WaveTimes Blog
Home » Will INR go to 57 per USD?
Inr

Will INR go to 57 per USD?

RamkiBy RamkiOctober 21, 2008Updated:January 31, 202313 Comments2 Mins Read
Facebook Twitter LinkedIn Telegram Pinterest Tumblr Reddit WhatsApp Email
Share
Facebook Twitter LinkedIn Pinterest Email

I have great respect for people who put in a lot of thought and come up with fundamental reasons why a certain move should take place. Thus, when I read a report from a leading (investment) bank that the Indian Rupee could reach 57 to the Dollar, I took the time to read it carefully. The reason why I read such reports is because a lot of other people also read them, and tend to believe them, and act on those views. Unfortunately, time and again, many researchers come up with forecasts when a move is almost over. As recently as 8th August, the INR was below 42, and today it is trading above 49. Don’t we wish that we were told of this move earlier? I am reminded of the calls for oil to reach $200 when it was trading at $145, and look where we are today. Similarly, there were panic calls when the Euro was approaching the $1.60 levels. Anyone who is told that the Euro will reach 1.75 when it was at 1.60 will surely panic. Having said that, I need to offer some other insight. Now let me caution you that I can be completely wrong, and these other guys perfectly on the dot. However, it is useful to temper your excitement/panic with a different view of the market. Let me keep it brief. I think we will not go above Rs.50.50 per dollar. And we will come down to around 45.25 quite quickly after we complete this up-move. Here are my charts, and you might wish to print this out and stick it along with the report for 57 per $ and give me a shout when we reach either level. At the very least, you would have taught me to temper MY own views! Cheers.
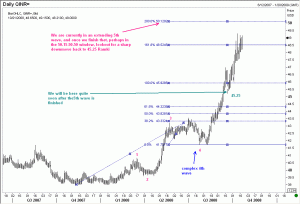
Will INR reach 57?
Will INR reach 57?
AXJ economic outlook Foreign Exchange Forex Indian Rupee
Share. Facebook Twitter Pinterest LinkedIn Tumblr Telegram Email
Previous ArticleAUD in a complex correction
Next Article Next dip in Sterling is a buy!
Ramki
  • Website

Related Posts

Spotting an easy 100 pip profit in Forex using Elliott Wave Analysis

March 1, 2017

Why Forex Traders Tend To Lose Money

August 14, 2012

Elliott Wave Analysis of USD/INR (Indian Rupee)

July 1, 2012
View 13 Comments

13 Comments

  1. guru on November 3, 2008 1:59 am

    Absolutely a brilliant call on INR. The bad thing about such a brilliant view is we traders “yeh dil maangey more!!”. guru

    Reply
  2. Pingback: Indian Rupee Revisited : Trade with Ramki

  3. indy on November 24, 2008 4:21 pm

    Hi Ramki,

    Came by your site-now i will visit regularly

    Great work

    Indy

    Reply
  4. Himanshu on January 23, 2009 6:31 pm

    Hi Ramki,

    Great work ramki. I really like your analysis.
    I am not sure where this i should be asking…But i want your Long term Views on GBP INR Pair ?

    Rgds
    Himanshu

    Reply
  5. Ramki on January 25, 2009 3:04 pm

    Hello Himanshu,
    Although the USD/INR could still revisit 50.25 (max 50.90), I think it will eventually come down to 45.00, or lower.
    GBP/USD, on the other hand has resistances at 1.3950 and 1.4100, with a downside target closer to 1.3100 or lower. For GBP/INR, I think we have early resistance at 69.00 and more importantly at 71. It is going to take a while for sentiment to become positive.

    Reply
  6. Himanshu on January 27, 2009 2:25 pm

    Thanks Ramki for your analysis on GBP/INR. It will be great if you can give regular update about GBP/INR too. Thanks again.

    Reply
  7. VIJAYA KUMAR BABU on June 7, 2009 11:26 pm

    Dear Mr Ramki, I would like to know your view on USD/INR for the next six months. Tks and regards

    Reply
    • Ramki on June 10, 2009 4:54 am

      Looks like we have come down to the prior fourth wave in INR already around 46.40. This should allow for a “B” wave type of a move higher. However, how far it will go depends on various fundamental factors. (Remember corrections of corrections are always harder to play). If we get a flat, then we go back to the previous highs. Otherwise, a 50% pull back should suffice. We have to monitor as we move higher, and that takes time and effort!

      Reply
  8. Pingback: Indian Rupee Revisited | Elliott Wave Analysis : Wave Times

  9. Jatinderpal S Randhawa on March 28, 2012 5:35 pm

    Mr Ramki please provide the long term chart for INR/$US.
    Thanks.

    Reply
    • Ramki on March 29, 2012 12:32 am

      Hi Jatinder, I think we have some good resistance around 52.10 for now

      Reply
  10. John on July 15, 2015 5:58 am

    We are already over 63.

    Reply
    • Ramki Ramakrishnan on August 7, 2015 7:15 pm

      John, Thank you. We are in 2015 and that post was made in 2008.

      Reply

Leave A Reply Cancel Reply

Recent Posts
  • Has Meta (Facebook) stock seen the bottom
  • What Is The Nearest Technical Support For Meta (NASDAQ: FB)
  • Using Elliott Waves to Capture a Trade in S&P500
  • Hedge Funds and Elliott Waves – Netflix $NFLX
  • When Elliott Waves applauds the promoter’s signals!

WaveTimes is a Research Organization dedicated to providing original analysis, reports, reviews, and insights on developments in mutual funds, stocks, investing, foreign exchange, commodities, and bonds.

Contact WaveTimes

L-601 Mantri Espana,

Kariyammana Agrahara, Bellandur, Bangalore 560103

Follow Us

  • Facebook
  • YouTube
  • Twitter

© 2023 Wave Times. All Rights Reserved.
  • About
  • Books
  • Privacy Policy
  • Policies and Standards

Type above and press Enter to search. Press Esc to cancel.