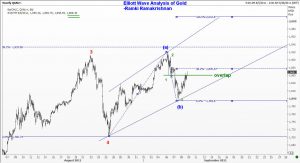
 When we use Elliott Wave Analysis in real time, there are warning signs on the way that tell us that perhaps we are on the wrong track. For example, the three wave rally to 1920 that I originally labelled as an irregular B wave should have been followed by a five wave decline (as a C wave). As you know, C waves should behave like impulse waves. However, we are witnessing an overlap of wave 1 by a recovery that started from the end of wave 3. If this were wave 4, then it should not have gone above the bottom of wave 1. So clearly something is going wrong. (Even if one were sort near 1850, the loss is limited to just 10-15 USD because the bottom of wave 1 was at 1860.)
Next we have to figure out what could be the scenario where we get a 3 wave rally to 1920, followed by a 3 wave decline to 1890 and then a new rally? One possibility is an ending diagonal triangle. typically, ending diagonal triangles have its internal waves made up of 3 waves. If this approach was correct, we should see a three wave rally that will make a new high now.
Should we trade this move? I am very reluctant to suggest a trade when the directions are changing so very quickly. But if we are able to confirm that an ending diagonal triangle is indeed developing, then we might be in a position to identify the end of the major move more confidently. I will post that when it becomes clear. For the time being, I would like to figure out exactly why we have an overlap after 2 successive three wave moves.

