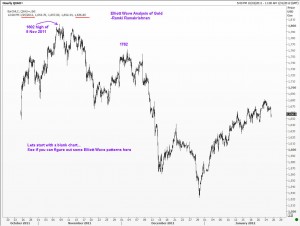
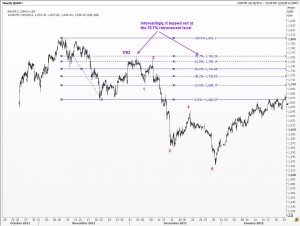
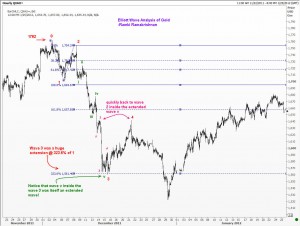
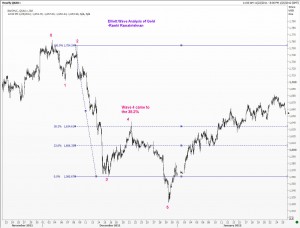
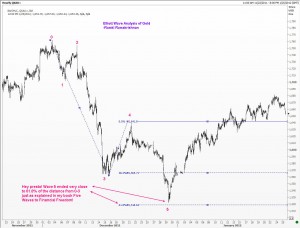
Hah! So you really think trading gold can be made easy? It certainly does look so with hind sight, as the following charts reveal. But honestly, if you learn some Elliott Wave analysis, you could have captured at least some of this move. Of course, just like trading any other instrument, you would have placed protective stops while trading Gold. For example, you might have thought that Gold would find resistance at the 61.8% retracement level, but it actually went to the 70.7%. If you had sold at the 61.8% level, you should have chosen your stop carefully, just above the next key resistance at 70.7%. Alternately, you would have joined in as the metal started moving down, with a stop above the high, Trading is more than just analysis. It concerns active money management. What WaveTimes does is to show you how to use Elliott Wave principle in order to bring a method to your trading activity.
So let us start by looking at how you could have captured many of the moves down. Remember, Wave Times had mentioned the target of 1480 a few months prior to the collapse, so you know which way it was headed already.
P.S. I will try and post more charts on trading gold in Forbes today.Click here if you wish to follow my Forbes comments.

