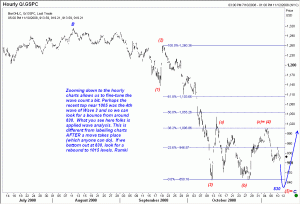
If my analysis of S&P500 (and Nasdaq) suggest that we will get a 5th wave move down, then how can I recommend buying Citi from $11.54? This is a valid question, and any good analyst should have thought that through. What I did, instead, was to look at the index and the stock separately.
Having conceded that, I looked at the S&P500 again in greater detail, and decided to post the accompanying chart. The whole decline from 1576 could be labelled as ABC/x/ABC and we are in the second “C” wave, which itself has 5 internal waves. I know this is wishful thinking at this time, but even if it is an incorrect approach to the patterns, we should expect a nice bounce in the index from 830 levels. Now let us turn to Citi. If this stock were to decline about the same extent as the main index, we will be close to $10. But even if it declines that far, it will still fit in the diagonal triangle picture. You might ask what is the value of a recommendation where one could see a 10% (or more) decline in price. You are quite right in posing that question. My strategy with Citi is to only buy small lots as we go down so that I will be in the trade when the reversal takes place. I am definitely not going to bet my daughter’s college fees on this one. But I will surely invest a sum that I am willing to see a 10% decline, but hope to double my money in a year. Enjoy!
Related S&P500 links:
Was that the stock market bottom?
SNP500 revisited
Fifth wave extensions can make you rich!
What is a significant rally in the stock markets?
Harmony in markets: S&P500
S&P 500: Potential Ending Diagonal Triangle
Ending Diagonal Triangle in S&P500?
S&P500 Elliott Wave update
S&P500 index: is a top already in?
S&P 500 update: where is the top?
S&P500 continues its rally
S&P500 remains resilient
S&P500 ready to dive?
S&P500 Update: May 19, 2009
S&P500 Elliott Wave update:21 May 2009
S&P 500 breaks higher: update 2 June 2009


