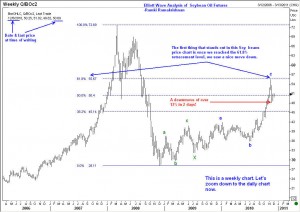
 Soybean oil futures have been behaving quite technically, and an alert trader could have spotted some easy low risk trades. Take a look at the first chart of CBT Soybean oil January delivery futures. This is a weekly chart. The first thing you notice is the price found very strong resistance at the 61.8% retracement level. This also happened to be a low sometime in early 2008 (look along the dotted line to the left in this chart).
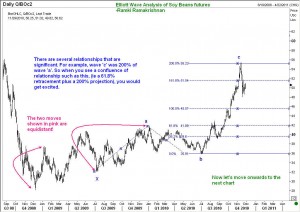
  If one had placed a sell order near there, with a not far away stop, he could have pocketed 13% in just 2 days! But do all 61.8% pull backs deliver such fantastic results? They do, if there are complementing techical factors. Look at the 2nd chart, which is a daily chart. Here the ‘C” wave of Soybean oil price movement is shown to be exactly 200% of the “A” wave.
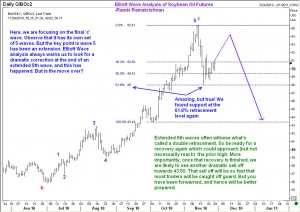
  When you have such a confluence of levels, then Elliott Wave analysis produces a more rewarding outcome. Finally, I would like to suggest that maybe we have witnessed an extending fifth wave in Soybean oil futures that finished at 55.41 levels, and hence the correction down should go down all the way to 43.50. But wait. Don’t rush out to sell! Often times, we get what is called a double-retracement once a fifth wave extension is over. We are probably in the middle of this 2nd retarcement. While it may not reach all the way to the high, be prepared to join in the selling as soon as a strong decline starts. That sell-off in soybean oil at that time will be mighty powerful, when it begings. Good luck.
Soybean oil futures outlook

Unleash your Potential
Transform your trading – Starting Today
