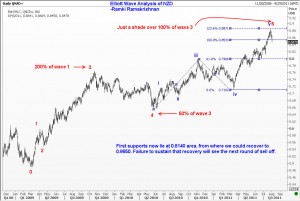
 It’s been a long easy (!) road for the New Zealand Dollar, the currency that Forex traders know more affectionately as the Kiwi. But it is increasingly looking like the honeymoon is over.
Take a look at the attached chart of the NZD that gives you an Elliott Wave Analysis of the currency. The New Zealand Dollar embarked on its journey back in 2009 from around the low of 0.4900 and it peaked on Aug 1st as 0.8840. That is an 80% appreciation, and I am sure exporters of the tasty butter and soft wool and healthy lambs must have been hurting all along.
Well, your troubles are probably over, because over the next few months, we should come off to 0.7970 initially, and shortly thereafter to 0.7760. Further out, we will see a continuation of the decline down to 0.7170 area. Some of the unwinding could happen with a reversal in Gold, and also a decline in the price of Oil. Commodity currencies should generally suffer in the process. But enough of the fundamental stuff. You already know my views in Oil – it will go down to around $71. So let us look at the outlook for NZD, or Kiwi.
Update on 29 August 2019:
Quick Question: Did you wish that you could learn directly from me on how to trade using Elliott Waves? Then you need not wait any longer. I have published what is now being acknowledged as the BEST course available online for traders. Check out https://elliottwaves.com and judge for yourself. Listen to the testimonials of people from around the world! Act now!

