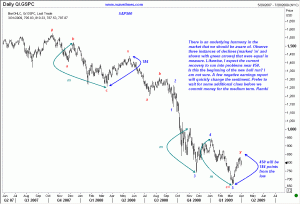
One of the key take-aways from Elliott Wave Analysis is that there is an underlying harmony in the markets, even though it appears chaotic while the moves are happening. It requires some effort to determine where the likely pressure points are, and a lot of guts to stake some money when those levels are reached. However, as any experienced trader knows, there is no money to be made unless one takes some risks. We use Elliott Wave Analysis to figure out levels where the risk is relatively small.
Take the S&P500 as an example. The attached chart shows how in the past the index has made moves that were identical in measure. Elliot Wave Principle tells us to look for relationships between alternate waves. Experience also tells us to look for relationships between corrections placed far away, while acknowledging that the nearer the corresponding pair is with respect to each other, the stronger the relationship. At this point in time, I am guessing that the current rally in the S&P is probably only a correction, and so relating it to a correction that happened some time back. If this works out, we should see the market struggle to overcome the 850 level. We shall see. Meanwhile, this is yet another example for you to learn how one can use Elliott Wave Analysis to trade the stock market.

Related S&P500 links:
Was that the stock market bottom?
SNP500 revisited
S&P500 and Citi
Fifth wave extensions can make you rich!
What is a significant rally in the stock markets?
S&P 500: Potential Ending Diagonal Triangle
Ending Diagonal Triangle in S&P500?
S&P500 Elliott Wave update
S&P500 index: is a top already in?
S&P 500 update: where is the top?
S&P500 continues its rally
S&P500 remains resilient
S&P500 ready to dive?
S&P500 Update: May 19, 2009
S&P500 Elliott Wave update:21 May 2009
S&P 500 breaks higher: update 2 June 2009

