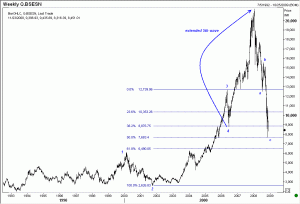
The easiest way to make money in any market is after a fifth wave extension. While identifying the precise end point of an extension is often a challenge, you can become quite rich by joining in once the correction starts. Typically, a market comes down to the level of 2nd wave of the just completed 5th wave (as wave ‘a’), corrects higher (as wave ‘b”) and thereafter collapses as wave ‘c’ to reach the 4th wave bottom (or lower!). In the last 3-4 months, there have been innumerable instances where we have seen this happen. Regular readers of this blog have been alerted to the opportunities. Today, I am going to review those trades so that you can have a permanent record in one place of how fifth wave extensions should be used to our advantage. Let us start with Oil.
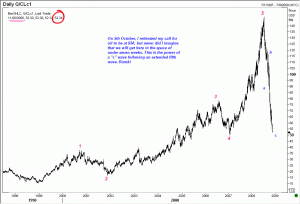
If you had been on my mailing list before this blog was started in October, you were warned when Oil was above $140 that we will go down to $50. As recently as 5th October, and on this blog, you saw this post. 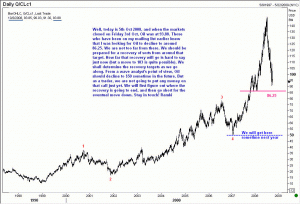
Today Oil is trading close to $52 as shown in this chart.
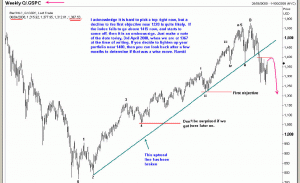
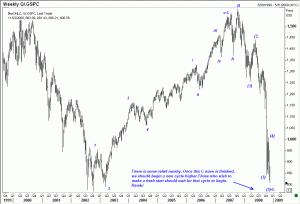
Now let us look at the S&P500. On 3rd April, I emailed several of you that we could recover from the current level of 1367, but failure to stay above 1415 could trigger a sell off to around 1050. Here is the chart of April 2008, followed by the chart of 20th November 2008 (today).
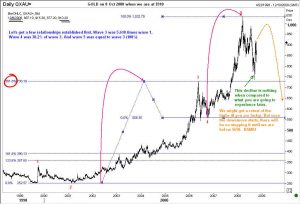
For those of you who are interested in GOLD, this chart should open your eyes! Just a few weeks ago, on 8th October, I wrote in your favorite blog that this precious metal was ready to collapse. That was when the commodity was trading at 910, and analysts at Credit Suisse put out a bullish report on Gold. Take a look at this chart below and judge for yourself. Gold has traded well below $700 before recovering recently.
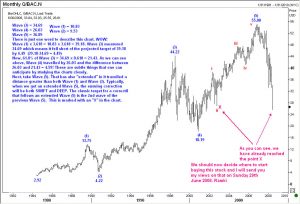
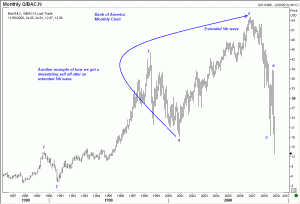
Let us look at a specific US Stock. Bank of America! This blue chip was at $26.61 back on 30th June when I alerted you that we will see it down to around $18. In fact, some of you will remember we bought the stock near there and made between 40 and 65% in a matter of days! (that was the ‘b’ wave rally). Here are two charts for your study.
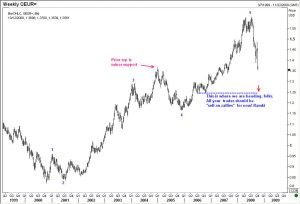
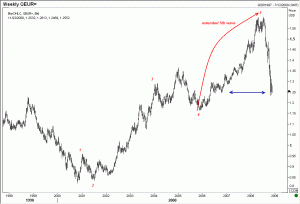
Next, let us take a look at the Euro dollar. The EUR/USD was trading at 1.3560 on 12th October when I warned you that we are on our way down to 1.25. Sure enough, it has gone there already.
Are you an emerging market buff? Then this chart of the Bombay Sensex should be revealing.
What is the lesson here folks? Technical analysis can be used to considerable benefit. Yes, when it comes to pulling the trigger we all are scared. (Honestly, I made money in only some of these recommendations because my stops were too close! And even then I could not risk a very large sum. But those who had the staying power made millions. One of my clients saved over $7 million by shifting his GBP deposit into USD just before the collapse. But coming back to the average Joe (the plumber 🙂 or trader) we should definitely take small risks at the end of fifth wave extensions. Please bookmark this post andshare with your friends. With best wishes. Ramki
Update on 29 August 2019:
Quick Question: Did you wish that you could learn directly from me on how to trade using Elliott Waves? Then you need not wait any longer. I have published what is now being acknowledged as the BEST course available online for traders. Check out https://elliottwaves.com and judge for yourself. Listen to the testimonials of people from around the world! Act now!
Related S&P500 links:
Was that the stock market bottom?
SNP500 revisited
S&P500 and Citi
What is a significant rally in the stock markets?
Harmony in markets: S&P500
S&P 500: Potential Ending Diagonal Triangle
Ending Diagonal Triangle in S&P500?
S&P500 Elliott Wave update
S&P500 index: is a top already in?
S&P 500 update: where is the top?
S&P500 continues its rally
S&P500 remains resilient
S&P500 ready to dive?
S&P500 Update: May 19, 2009
S&P500 Elliott Wave update:21 May 2009
S&P 500 breaks higher: update 2 June 2009

