Elliott Wave analysis is one of the most versatile tools in the hands of a trader, provided he/she knows how to use it correctly. At WaveTimes you have the opportunity to learn more about the Elliott Waves.
Old timers know that my favorite formation is where we see an extended fifth wave. In fact, it has been a recurrent theme in WaveTimes that extended fifth waves can make you rich. You can do a search for that in the web and see the various examples given in this blog. I believe the concept has also been well covered in the book “Five Waves to Financial Freedom”. In today’s post, we will look at a popular index in the Indian markets known as Bank Nifty Index.And you guessed right, we will see another example of an extended fifth wave and what happened next. And importantly,these concepts will work in ANY well traded market, and even if you don’t have any interest in India’s BankNifty Index, I suggest you spend a few minutes to read and understand the Elliott Wave ideas enumerated below.
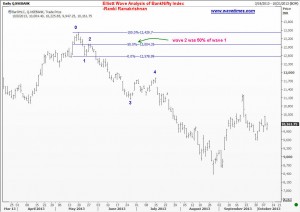
The way to start counting your waves is from a significant top or low. Let us start with the important top around 13,430 that was posted on May 20, 2013. I suggest that you right click each image and open it in a new tab.
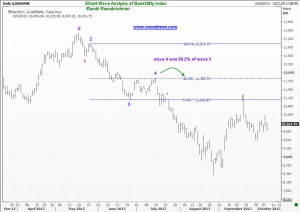
As you can see, the first sell off is labeled as wave 1 and we got a 50% correction of that as wave 2. The next wave down was the third wave, and this was followed by a ‘Flat’ correction as the fourth wave. This fourth wave was 38.2% of the third wave as shown in the Elliott Wave chart below.
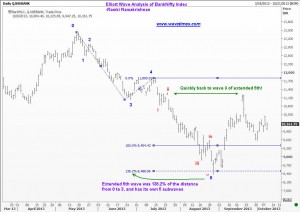
After the fourth wave was completed, the markets set off earnestly to the South and we got an extended fifth wave. As you know, a wave is known as an extended wave when its proportion is unusually long in relation to its counterparts in the cycle.
The extended fifth wave shown above has traveled 138.2% of the distance seen from the start of the first wave till the end of the third wave, i.e. from points 0 to 3.But what happened afterwards is most instructive. True to its form, once the extended fifth wave completed its own minor fifth wave, we got a massive bout of short covering, and the market raced back to the level of wave ii within the extended fifth wave. This is what I have taught you many times in this blog and in my book. Imagine how much you could have made by buying near the end of the extended fifth wave!
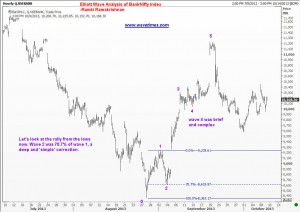
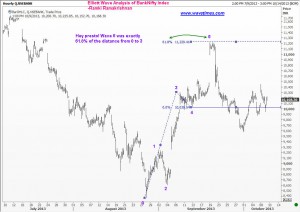
My next Elliott Wave chart shows how the rally evolved from the lows. The chart below shows that we got a second wave that came down by 70.7% of the first wave. As you probably remember, there is something known as ‘alternation’ in Elliott Waves. If wave 2 was a simple correction, we should expect wave 4 to be complex. Likewise, if wave 2 was a deep correction (as is the case here) we should anticipate the 4th wave to be shallow. These are all illustrated here for your benefit.
And finally, could one have anticipated where the fifth wave will finish for teh rally from the bottom? Of course, yes! Remember what you read in “Five Waves to Financial Freedom”? We compute the target for the fifth waves by measuring the distance from 0 to 3 and then calculating some ratios. In the present case, the fifth wave finished exactly at the 61.8% measure of the that move. See the next chart for this.
Well folks, that brings us to the end of this post. What you need to know is that it is possible to anticipate the terminal points of moves, and while there are no guarantees that it will work, you will have a chance of taking a low-risk trade at those points. Trading is all about taking sensible risks. This is what we should all be doing. I realize many of you still have difficulty in counting waves, but that is a challenge you will overcome with practice. Good luck.
Ramki
https://blog.wavetimes.com/

