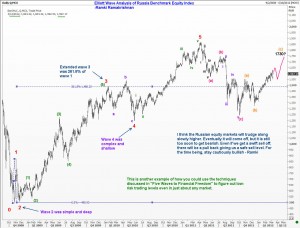
Elliott Wave analysis can be applied to just about any well traded market. In this post, we shall discuss the outlook for Russian stock market using their benchmark index.
We start our Elliott Wave labeling from the significant low of 494 posted back in October 2008 and observe that the third wave had extended to cover a distance of 261.8% of wave 1. The fifth wave has developed as a ‘normal’ wave because it was not longer than the 3rd wave. Once the five wave sequence was completed, we got a correction that brought the index down to near the prior fourth wave, but did not quite reach that level.

The key point for us to note now is how the subsequent recovery turned out. If the entire prior 5 wave rally is considered as Wave 1 of a higher degree, then we should be embarking on wave 3 of a higher degree as well. How should a third wave look like? Does the current rally look like a third wave? These are the questions an ELliott Wave trader should ask himself. Then he makes a judgement call. I think we will probably get to around 1730 and start coming off. Any overlap of the top of what I have labeled as Wave (a) in orange color will be decisive in confirming that we are only seeing an ‘X” wave and so another a/b/c downmove will happen. Let us take it one step at a time. For now, wait for the rally to take us higher a bit.
This discussion about the Elliott Wave outlook for Russian stock market index is just an example of the kind you would find in my book “Five Waves to Financial Freedom”. Go ahead and check it out yourself.

