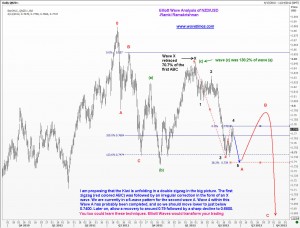
The chart for New Zealand Dollar offers some interesting patterns from an Elliott Wave perspective. (Many readers would remember that it has been possible to anticipate some significant moves in the Kiwi using Elliott Wave Analysis).
The attached chart shows that we could be unfolding in a double zigzag, with a long-term target of around 0.6800 or lower. For the immediate future, however, we should be quite happy with a 4.5% downmove to just below 0.7400. after that, we will look for a recovery of between 38.2% and 50% of the 5-wave decline that finished below 0.74. Once this correction is done, lookout for a sharp sell off towards 0.6800.

As usual, you will find several more Elliott Wave notations on the chart itself. Observe the Fibonacci relationships and the underlying rhythm of the market. You too can learn these techniques. It just requires a little bit of effort to find the time to try it yoruself. Good luck. Ramki

