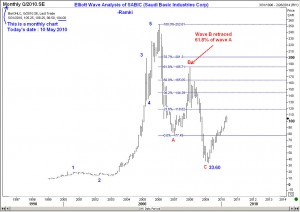
Here is the Elliott Wave  Analysis of Saudi Basic Industries Corporation, or SABIC. Actually there are two charts that I would like you to see. The first is a monthly chart that shows the huge 5-wave rally to 252.61 has been corrected by a 3-wave decline. Wave B retraced Wave A by 61.8%, and then we got the unholy dump.
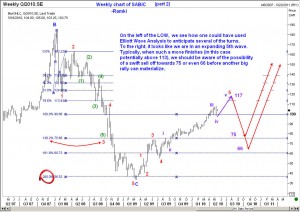
 The second chart on the right shows not only the internal waves of Wave C, but more interestingly, the current rally from the lows. What I can see is an extended 5th wave. Now you all know how much I love a fifth wave extension, because fifth waves can make you rich. Go back and see the numerous examples of extended fifth waves in this blog and you will be amazed! Once we finish this fifth wave, I am looking for a sharp sell off that can easily take the stock of SABIC down to the 75 or even 66 Saudi Riyals level. So be ready for that event.

