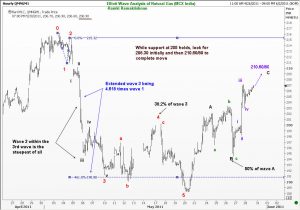
Elliott Wave Analysis of Natural Gas Futures traded on MCX India. To be honest, this is the first time I am looking at this contract, and what I see is fascinating. There were so many easy opportunities to trade the Natural Gas Futures profitably on the MCX in India!
So what do the Waves tell us? First of all, we can see a clear five wave down move on the left of the chart. There was an extended 3rd of the 3rd wave, a move that covered 4.618 times the distance of the first wave. Next, you would have prepared yourself for a complex correction because the 2nd wave was simple. Sure enough, you got an irregular ‘B’ wave. The 4th wave ended nicely at the 38.2% retracement level of the 3rd, and the final 5th wave also finished at a technical level (50% of the distance from 0-3).
You would have gone long the Natural Gas futures contract near the end of the 5th wave. There was a bit of choppy correction that ensued, because the B wave also was an irregular correction, but hey-presto, it finished at the 50% retracement level. Anyone who was patient could have loaded up nicely near there (waiting to add at the 61.8% lvls, but which never showed up!). Then we embarked on the “C” wave, which I think has just finihed its own 4th wave, and we are in the fifth wave of this move. So it is rather late in the day to consider buying now. Rather one will watch to see what happens near the 210.60/80 and sell there if the momentum fades.
That concludes this short lecture on Natural Gas Futures on the MCX in India. Share it with all those whom you think want to learn how to trade commodities using Elliott Wave Analysis.
Update on 29 August 2019:
If you love my book FWTFF, then you will love my online course even more! That course will take your understanding of Elliott Waves to a whole new level, because it teaches you how to APPLY what you learn in my book to actually make profits in the markets. Here is the link: https://elliottwaves.com

