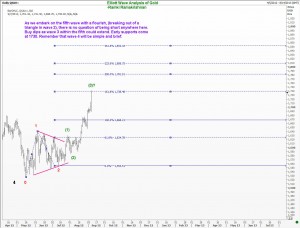
It is a while since I posted Elliott Wave Analysis of Gold. Septerber 2012 has started off with a a sharp rally in this precious metal and there have been persistent requests for an update. Lets look at the charts and see what clues we might get.
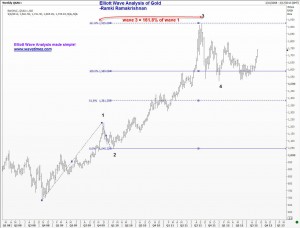
I frequently go back to the most recent significant low and see if any sense can be made of the moves from there. Accordingly, I am starting my wave counts from the October 2008 low of $680. (By the way, when I am doing a fresh analysis, I don’t cloud my mind with any wave counts that I might have made several months earlier. Markets change, and it is always good to start afresh). My first attempt produced this chart you see below.
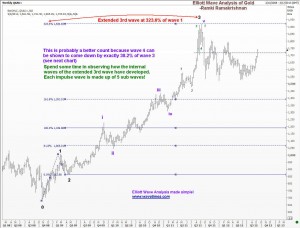
You can see that wave 3 was 161.8% of wave 1. So far so good. But is it possible that wave 3 was an extended wave? Lets take a look at the next chart. Here the internal wave counts (the sub waves) within wave 3 show that perhaps this is a better way of labelling the chart.
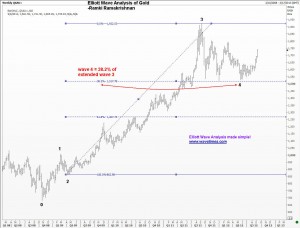
You can see that wave 3 has travelled a distance equal to 323.6% of wave 1. Clearly, this is an extended third wave. What is more! As the next chart reveals, the fourth wave came down by exactly 38.2% of the third wave.
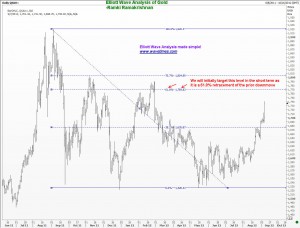
Having sort of settled down on how the recent moves can be counted, we turn next to figuring out pressure points for the future moves. A fibonacci retracement grid revealed that the key resistance at the 61.8% level falls at 1770. This is not only going to attract, but there is a chance we might get a small correction from there. Remember what I discussed in the article today “what next for the s&p500” posted earlier today? We should trade in the direction of the trend, and where the odds are in our favor. Clearly, if we are going to get a 5th wave higher, there is a lot of room on the upside. Besides, the recent action by the ECB only increases the chance for high inflation and that is fundamentally good for Gold, In these circumstances, we should avoid selling at minor perceived resistances, and focus on identifying low-risk entry levels to join the next step higher. So although a resistance lies at 1770, we should be more willing to buy any correction from there, rather than selling at the resistance.
Use the 61.8% retracement level to signal the possibility of a dip that you can use to join the trend, even if it is a short term trend. Now let us pause and consider whether Gold can collapse for some reason. Sure, anything can happen. But in my view, even if Gold breaks down dramatically, we will likely see a rebound to near last week’s highs before it follows through. And if a trader had gotten long on a dip, then there would be a good chance for a safe exit if things turn unexpectedly bad. It is intelligence like this that Elliott Waves offers a thoughtful trader, and hence, why it pays to learn the techniques. It goes without saying that a trader who trades without a stop-loss order in place is a gambler. He is not a trader. Good luck.

