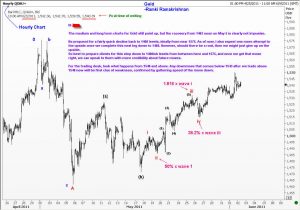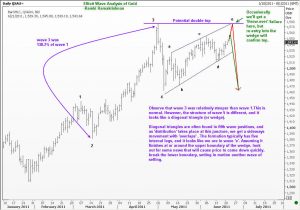
 On 9th May you saw the post “Last Hurrah for Gold..” where we looked for one final push higher from the current level of 1499. Then, on 2nd June and again 21st June, I had prepared the following two charts for the Global Head of Commodities Trading in a leading international bank. I would like to share those two charts with you now, so that you can see how one could have used Elliott Wave Analysis to identify low-risk trading levels. As you are aware, Gold fell to 1478 last week from a high of 1562. Enjoy
Elliott Wave Analysis of Gold

Unleash your Potential
Transform your trading – Starting Today
