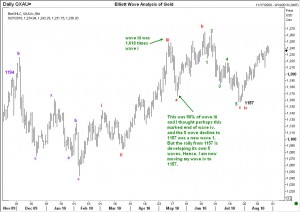
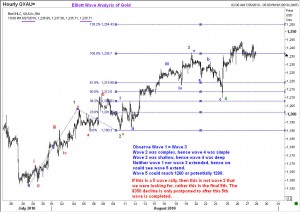
 When I presented my wave analysis of Gold on 25th July, we were looking for a rally from around 1157 because a 5-wave decline seemed over. I also warned to wait for the selling to start before joining in. During the month that has passed, Gold has rallied as expected, but the rally is taking a 5-wave pattern. Now this is a valuable clue for the trader. If we were correct in our labels, the current recovery should be a 3-wave pattern (being a 2nd wave as per our older analysis).
 When we see a 5 wave pattern, and other indicators are still pointing higher prices, we should do two things. First, revise our old count and postpone any thought of selling. Second, look for possible targets for the top. The possible targets are shown on the second chart here. Remember, we are still in the planning stage for the next trade. When the time to sell comes, it will be clear to us, and I hope to update you again. Enjoy!
Elliott Wave Analysis of Gold 29 Aug 2010

Unleash your Potential
Transform your trading – Starting Today
