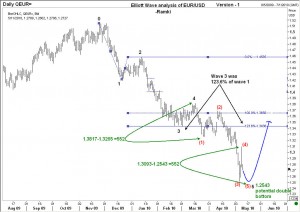
“Lending more money to already over-borrowed governments does not solve their problems” says Mr Carl Weinberg. The FX markets seem to agree, as the Euro is rapidly giving up a lot of the gains it made yesterday. Are we going to 1.1700 directly? Let us start by acknowledging that just about anything could happen. A technical specialist sitting in Kuwait is not going to make any difference to the outcome. Neither can any of the politicians or economists. The markets are driven by fear and greed. But this is exactly what Elliott Wave analysis seeks to deal with.  Let us try again. I present you with two scenarios. (Remember that wave counting is always a work-in-progress, and no one can state with 100% certainty which is the right label until after the move is over. Yet, when we approach the markets in a consistent way, there are rewards to be had). The first scenario suggests that we are in the 5th wave and if the 5th wave of the 5th equals the 1st wave of the 5th, then we will bottom out close to the previous low.
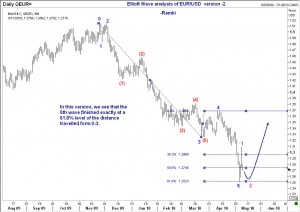
 The second scenario suggests that we have already posted the end of the 5th wave and so what we are seeing now is just a deep correction of the first wave of a new uptrend. Both scenarios would imply that in the coming weeks the Euro will trade significantly higher, towards 1.35 levels. Now, I could be completely wrong this time. I have been wrong before. However, I do seek to be consistent about what I say until proved wrong. For finance managers who wish to hedge their exposures to Euro, this dip is ‘manna’ from the heaven. If you had attempted a trade yesterday by picking a bottom, that would have lost you some money. A trader has to always protect his capital by using sensible stops. The benefit of technical analysis comes from providing you with low-risk trading ideas, not ‘risk-free’ trades. Good luck today and beyond.
-Ramki
P.S. Thomson Reuters are sponsoring a Trading Room Chat via their messenger service for MENA region tomorrow. Yours truly will be conducting the event. Will try to publish the charts in this blog afterwards.

