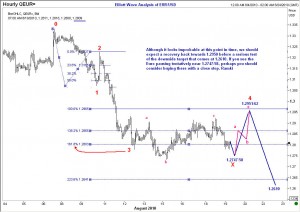
 Elliott wave analysis requires the trader to have an open mind about what could happen. The wave principle is capable of giving you a road map. You follow the signs until you run into an obstacle, at which time you will be presented with another map. Unfortunately, most traders start with good intentions, but decide to abandon the original map in favor of something more appealing. They then seek a fresh set of clues from wave analysis, which, if started from a new starting point, could be all wrong. It is hard to explain these, but I am sure many readers have experienced these things. Anyway, I present you a map today. The chart of EUR/USD shows one version of elliott wave analysis . I could be wrong, of course. But at least I have a plan, and I will know when I am wrong. Why do I expect a recovery back to 1.2950? It is because I would like the complexity of this correction to be more intense. If you had chosen the end of wave 3 to be at the point ‘b’ below 1.2750, you would have labelled the point ‘c’ just above 1.2900 as the end of wave 4 (it is tempting because that level was 38.2% retracement of wave 3). However, the correction would not have been sufficiently ‘complex’ in my view. Hence, I am not going to be a seller today. I would rather wait and see what happens near 1.2748/58. Good luck, and nice weekend. Ramki
Elliott Wave Analysis of EUR/USD 19 Aug 2010

Unleash your Potential
Transform your trading – Starting Today
