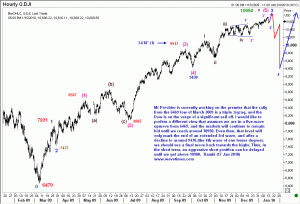
Here is the Elliott wave update on the Dow Jones as of 17 January 2010. It has been a while since I looked at this chart. Someone sent me a note that Bob Prechter has called the top in this index, and he had read about it in Planet Yelnick. So I decided to take a fresh look at the chart for the Dow, and you can see my wave count right on the chart itself. 
One of the frequent criticisms against Elliott Wave analysis is that the same chart is capable of so many different interpretations. However, the experienced trader knows that in order to make money, one should follow any ONE count at a time. Only then can the trader know when he is wrong. As soon as he realizes he is wrong, he can take quick corrective action, perhaps switching to the alternate count that he prefers. As for the Elliott wave counts for the DOW, no one can be sure who has the correct wave count until the move is over. By that time, it will be too late to do anything, and the whole exercise will become academic. So I urge traders to read Planet Yelnick for comments on Prechter’s count, then go to Tony Caldero’s page, and finally come back and read my own count. Then you decide which one you wish to adopt for the time being, and stick with any one of us. At some point you will know whether you are on the right track to making money or not, and then you can decide your next course of action. Good luck. Ramki

