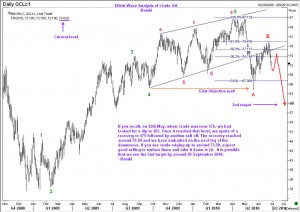
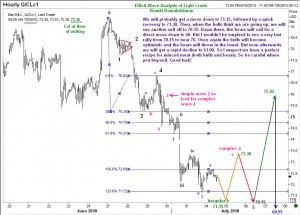
 I will be addressing the Reuters Global Oil Forum this morning at 8.45 London time, and presenting my Elliott Wave Analysis of Crude oil. As many of you won’t have access to that platform, I am posting the charts here. These were prepared late yesterday evening (when oil was trading at 72.36).
My baseline case remains that we get a move down to around $60. However, the path to that is likely to be perilous. There are some persuasive reasons why we should expect a lot of choppy action. Even as I am writing this, Oil has already been to the first target I have mentioned in the chart and recovered smartly. This only reinforces my view that many traders are going to lose money in the next few weeks. They are going to get bullish near the top and bearish near the bottom. While Elliott Wave analysis gives you a road map, you cannot expect it to produce a rabbit out of the hat every time! ( If you want to read about the magic of Elliott Wave Analysis, there is a link at the top of this page. But even my most recent update on GBP/USD looks magical in retrospect). Coming back to Crude Oil, beware of a move back to 76 before a big move down. However, there is going to be a lot of blood letting before we reach our targets.

