Elliott Wave analysis can be applied to any number of securities, be an individual stock or index or commodity, or just about anything that is traded in a liquid market. Today, we will take a look at the Elliott Wave analysis of Arabtec Holding Co. This us a popular stock that trades in the Dubai financial markets. In case you haven’t heard, Arabtec Holding Co. (ARTC) headed for its biggest three-day rout since March 2013 as some investors speculated Aabar Investments PJSC, its second-largest investor, is cutting its stake in the Dubai builder. To tell you the truth, I hadn’t heard the news either until AFTER I prepared the charts and mailed them to a friend who runs a large trading desk in Dubai.
The first chart below shows a couple of interesting things. For example, we have a failed 5th wave within the larger first wave. That was followed by a deep correction that went past the 50% retracement level.
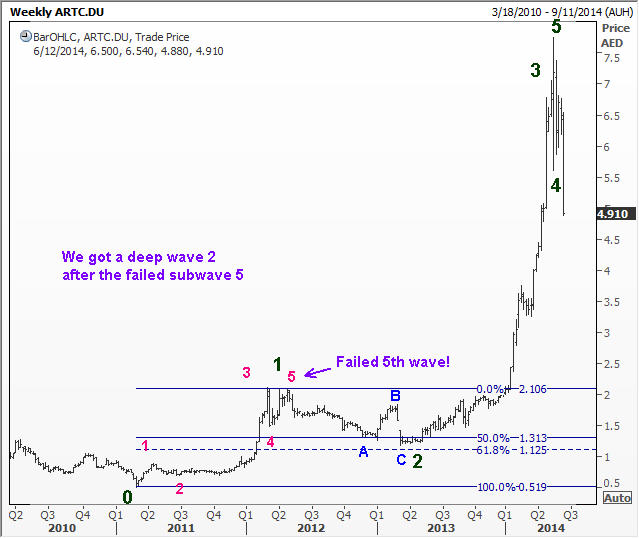
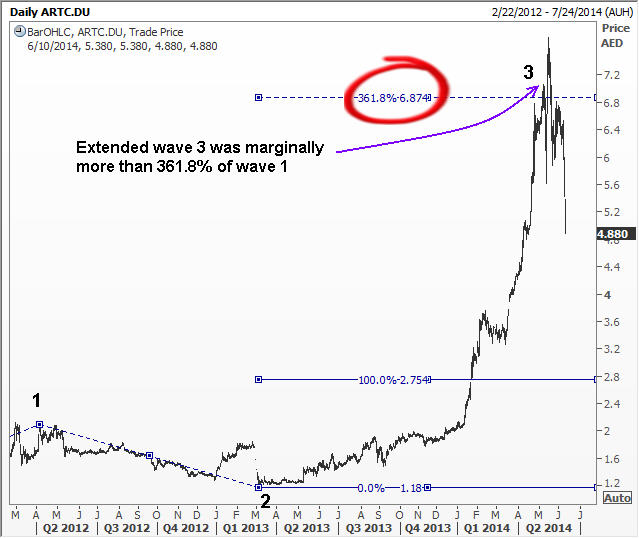
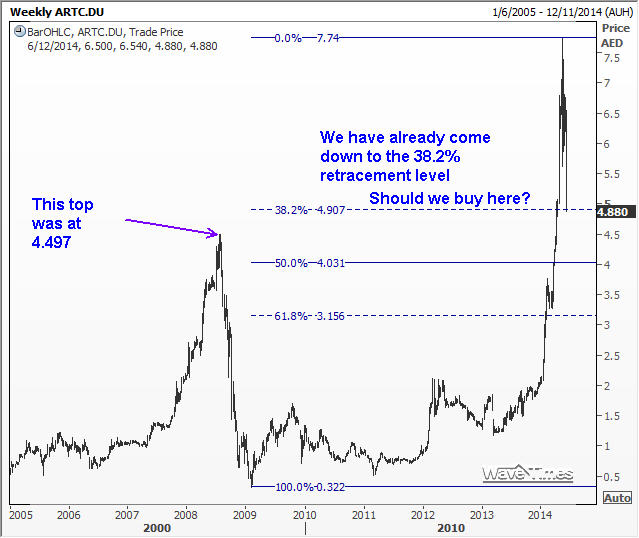
We then got a fantastic rally was an extended third wave, which went to the 361.8% projection level of wave 1.
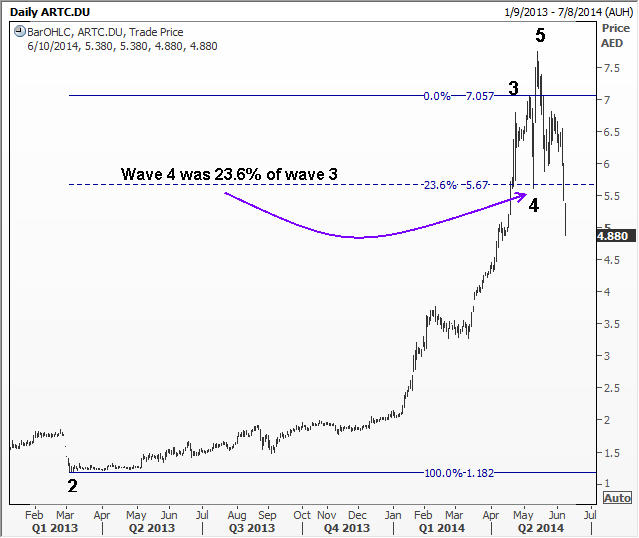
After an extended third wave, it is usual for wave 4 to come down to the 23.6% retracement level. This is what happened with Arabtec
We can anticipate the end of wave 5 by establishing relationship with wave 1. With Arabtec, it was 123.6% of wave 1.
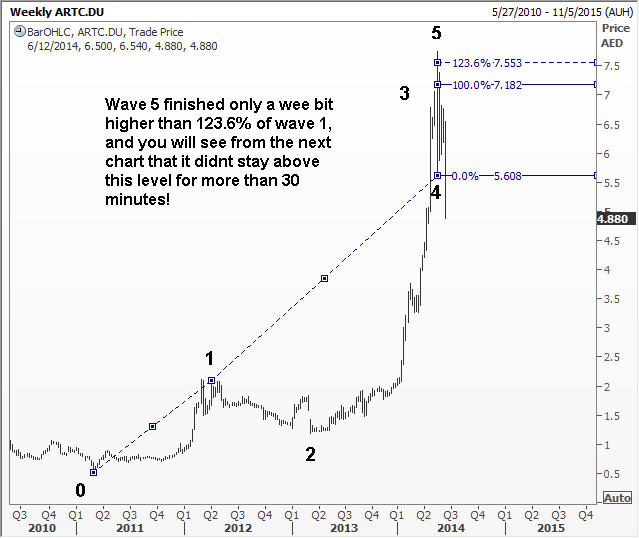
If you are wondering how far the fifth wave went past the target, take a look here
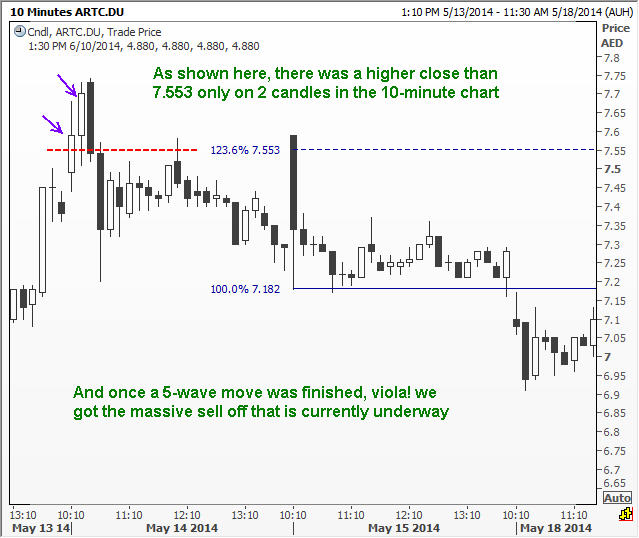
And what happened at the end of a five wave move?
Arabtec probably has a little more ground to the downside, so we have to look at the near term charts to figure that out. I am sure you are now capable of doing that exercise. Go ahead, and give it a shot.
