 I would like to share with you some charts that demonstrate how to use Elliott Wave Analysis in the real world.
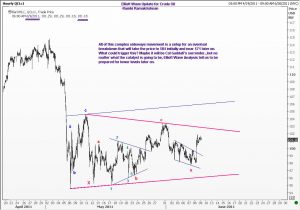
The first chart, dated June 9, (when Crude oil was at 101.18) shows a large triangle. As you know, I have remained faithful to the bearish outlook throughout the recent weeks, even in the face of bullish calls from other analysts. This in itself is an important lesson for some. It is essential to stick to one count until proved wrong, or until fresh clues emerge.
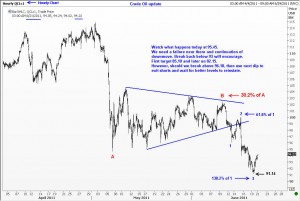
 In the second chart I have redrawn the triangle (and called it Wave B). The sell off that started from point B has already completed 3 steps. If this is a C wave, we should see it complete the 4th wave around 95.10-45 and come off as a fifth wave. We would also look for the 5th wave to extend. However, if we see it trade above 96.10, then we will use any dip thereafter to exit shorts and wait for better levels to reinstate.

