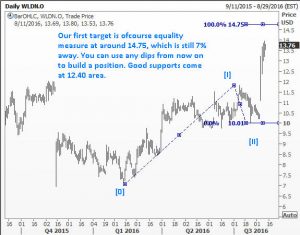
Elliott Wave analysis of the Willdan Group stock (NASDAQ:WLDN)reveals some interesting clues. The most important one of course is it has likely embarked in wave 3, and that means a minimum upside target of 7% from even the current levels, but likely much more.
Willdan Group, Inc. is a holding company. The Company provides professional technical and consulting services to utilities, private industry and public agencies at all levels of government. It operates through four segments: Energy Efficiency Services, Engineering Services, Public Finance Services and Homeland Security Services.
As always, WaveTimes members would like to enter a position when it is advantageous. But pull backs during a wave 3 phase is usually limited. The purpose of this blog is to share with you my approach. If you remember, WaveTimes is an extension of my book Five Waves to Financial Freedom. Those seeking specific analysis on individual stocks might want to look at the premium service.
Before we begin, you might wonder what prompted me to look at this particular stock. Truth be told, I have never heard of it until this morning, when good old Bob D suggested that we might be in Wave 5. As it has been a while since I wrote something on WaveTimes, I thought why not share it with you too.
WaveTimes Philosophy on using Wave counts
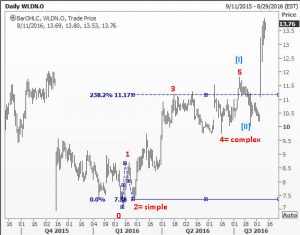
You might remember that my philosophy is to leave the long-term forecasts to others, and focus instead on what can be used in the near term. I also abandon a wave count once it has served its purpose. That means I am not married to it and will never try to justify a wave count. It is what I feel! (I am referring to the wave counts). A few weeks from now, if you show me the chart of WLDN, I might offer you a different count. What matters is whether we can use the wave count to trade. It is precisely for this reason why traders from around the world value what WaveTimes has to offer. Having gotten that off my chest, let us jump straight to the first chart which shows the internal waves of wave [1].
Lo and behold, minor wave 3 had extended to reach 238.2% of minor wave 1. A newbie might say ‘hang on, 238.2% is not a fibonacci ratio!’. As explained in FWTFF, this number shows up often enough in the real world that it is futile to quarrel over whether we need to see only a Fibo number to allow us to include it in our armory. You also notice the alternation between wave 2 and wave 4 in terms of extent, time, and complexity. Kapish!
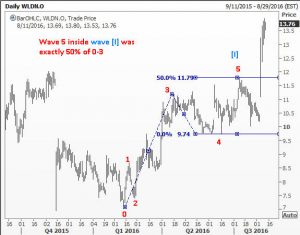
The next chart shows you how we could have identified the end of minor wave 5. It finished at 50% of the distance from point 0 to point 3.

Trading wave 3
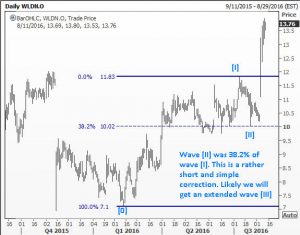
Now we need to discuss something rather important. How on earth could we have known that the wave 2 will go no lower than a 38.2% retracement shown in the following chart?

Alas, if only everything was given to us in a platter we would all be dancing in Hawai with pretty girls. There is really no way one can tell how low a second wave can go. All we know is it cannot go below the bottom of wave 1. So how can we ever get on board a third wave move? Now that is a legitimate question. I can share with you dozens of stories (actually it is hundreds of stories over my 30 year career) where I have missed a third wave move because I was waiting for it to dip. Some lessons are never learned, and some are learned after great struggles with one’s self. When you see a sharp rally, accompanied by gaps and increasing volume, you just have to BUY first and ask questions later.If you wait for a third wave to pause and come back for you to finish your coffee and discuss with your team or whoever else you check with, then you will miss great levels to buy.
Just remember one thing. This advice works only for 3rd waves! And for you to know that it is a 3rd wave, you should know that the first wave is finished! How will you know that? I suggest you read FWTFF again. Most people say they have read it three or four times and every time they learn something new.
Now for the last chart in this episode. How high can wave 3 go? I have learned the hard way that we should take things one step at a time. Let us start with the equality measure. And who knows, maybe we will get lucky and get a dip as sub wave ii of the 3rd wave from the equality measure.

The goal of all analysis is to make money. With the methods you learn here, you should be able to improve your score. All the best.


