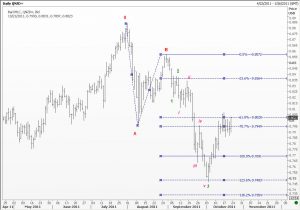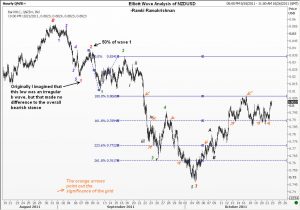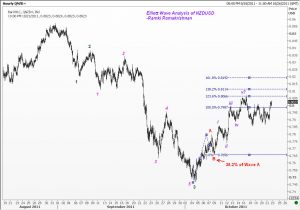


 Elliott Wave Analysis can become addictive to many a trader who discovers its potential. The harmony between the several waves in a pattern can be seen in almost every chart presented in Wave Times. In my book “Five Waves to Financial Freedom” I have used the Elliott Wave Analysis of New Zealand Dollar or NZDUSD to illustrate some of the key concepts of the Wave Principle. About two weeks ago, I sent out a special update to those who had purchased the book giving the wave counts for the moves that unfolded after the publication of the book. The currency had travelled an astonishing 10 big figures from the top, and it was possible for a trader to anticipate that move by applying the power of Elliott Wave Analysis to refine his trading strategy.
The key to success in the markets, and in using the Wave theory to trading lies not so much in whether you have got the minor wave count correct, rather it is whether you are riding the bigger move in the correct direction. This concept has been exemplified in my book in greater detail. Take the New Zealand Dollar as an example. Those who received the special update saw my logic for placing the end of Wave 1 at a particular point. However, I have today moved the end point for wave 1 to a higher location. In the bigger picture, it makes little difference to the overall outlook that the NZDUSD will come off again. However, by moving the end point of wave 1 a tad higher, I am giving myself the flexibility to allow the current wave C some more room to the upside, and still calling it part of wave 4 because it won’t overlap the bottom of the wave 1 that has been adjusted upwards.
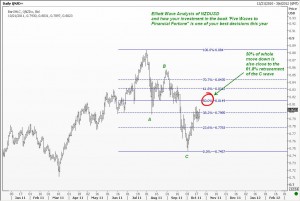
Some may call this manipulation of the wave counts to suit my end. But the philosophy that Wave Times has adopted all along (and which I hope the readers of this blog will come to appreciate) is we don’t wish to be a purist and a pauper. We wish to profit from Elliott Wave theory by applying it the way it was originally meant to be. I can vouch safe that there is not a single person alive who can claim to be able to count the waves accurately before a big move is finished. What one can attempt is to figure out the best possible level for a low-risk trade, and enter the market near there. Success in trading goes beyond this first step, because we have to use proper money management techniques to preserve our capital. In today’s post, I have shown you one such sweet point. That level is a 50% retracement of the whole down move, and is not too far from the potential end point for the C wave up. Additionally, it is also a 61.8% retracement level for the ‘C’ wave (from 0.8571 down to 0.7466). Whether this recovery is a fourth wave or not really does not matter to the trader. (It might matter to an analyst who is trying to make his mark among his readers, but to the reader himself/herself what matters is the end result). For example, we could have finished an ABC wave down to the 0.7466 level, and what we are seeing is an X wave, but the key point is we remain bearish. This bearish stance is what matters to the trader.
I hope that this unusually long treatise on Elliott wave analysis (Ramki style!) resonates well with you. If you have received the special update earlier, keep a print out of that along with this post and it will enhance your learning.
With best wishes, Ramki
Elliott Wave Analysis of New Zealand Dollar NZDUSD

Unleash your Potential
Transform your trading – Starting Today
