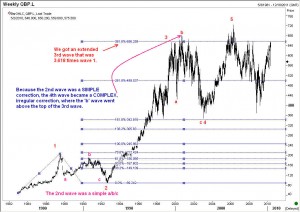
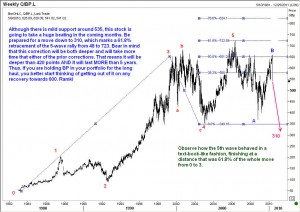
Today I came across a report where an analyst was calling for BP to reach 730 pence from its current level of around 575.50. However, from an Elliott Wave perspective, the outlook for BP doesn’t look so rosy. I am of the view that we are headed a lot lower. Take a look at these two charts. The first chart on BP shows that wave 3 was extended, being 3.618 times wave 1.
  We also see that wave 4 was an irregular correction, which follows the elliott guideline of alternation. The 2nd chart confirms that the 5-wave progression was finished around 722 and so a full-blown correction was due anyway. Wave A of the anticipated 3-step correction was finished and we also got a wave B before the oil spill news hit the market. So we have probably embarked on wave C which has targets at 310.
Updt: 7 May 2010: Someone asked me a question about the 5-year time frame for the correction. Remember, that time runs from the top of wave 5 (at 722) and not just for wave C. As that top was posted in early 2006, the correction will last at least till early 2011.
Update on 29 August 2019:
Quick Question: Did you wish that you could learn directly from me on how to trade using Elliott Waves? Then you need not wait any longer. I have published what is now being acknowledged as the BEST course available online for traders. There are over 14 hours of videos in High Definition, much more than any other Elliott Wave course in the internet. Check out https://elliottwaves.com and judge for yourself. Listen to the testimonials of people from around the world! Act now!

