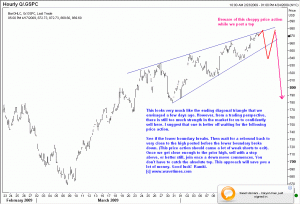
On 8th April, we saw the possibility of the markets moving higher as part of the final leg of an Ending Diagonal Triangle in S&P500 index. As the attached chart shows, this up move has materialized. The question now is should we put on short positions around the current levels?
When we use Elliott wave analysis to determine what our next action should be, we should always bear in mind other clues. I think the market still has some strength left in it. This means there is a risk that it will take a few sessions more before we get the down move that will reward us for the risk we will be taking. The best way to trade from here will be to wait for the lower boundary of the wedge to break. Most likely we will get a whip back inside the wedge to approach the top that will be posted soon. Failure to break higher to fresh highs will be our strongest indicator that a decline is ready to happen. That is when we should sell. Good luck. Ramki

By the way, according to Martin Armstrong, 23rd April 2009 could be an important day for the markets. If you would like to know more, I suggest you look up a nice post on Leveraged Mutual Fund Trading.
Related S&P500 links:
Was that the stock market bottom?
SNP500 revisited
S&P500 and Citi
Fifth wave extensions can make you rich!
What is a significant rally in the stock markets?
Harmony in markets: S&P500
S&P 500: Potential Ending Diagonal Triangle
S&P500 Elliott Wave update
S&P500 index: is a top already in?
S&P 500 update: where is the top?
S&P500 continues its rally
S&P500 remains resilient
S&P500 ready to dive?
S&P500 Update: May 19, 2009
S&P500 Elliott Wave update:21 May 2009
S&P 500 breaks higher: update 2 June 2009

