Elliott Wave Analysis of IBM presents a fascinating study of how one could profit from the use of this approach to trading the stock markets. Today I present you three charts that show you how IBM stock moved exactly as an Elliott Wave text book would have described it.

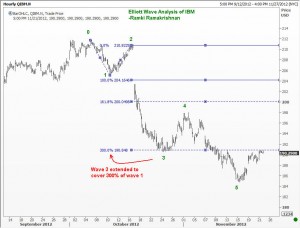
Starting from a significant high seen in IBM, we are able to count the waves easily. Observe that wave 2 did not exceed the top of the first wave. We then got a swift sell off as a third wave. You will also see that the third wave was an extended wave, traveling a distance of 300% of the first wave. Elliott Wave theory suggests that at least one of the three impulse waves in a five-wave sequence would likely extend. ie travel an unusually long distance. My book “Five Waves to Financial Freedom” explains that we often consider a third wave as extended if it travels a distance greater than 161.8% of wave 1. Let us now look at the next chart.

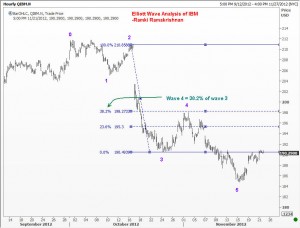
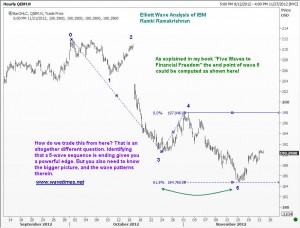
Typically when a third wave extends, the ensuing fourth wave travels only 23.6% of wave 3. However, this is not a rule, and we often do see a 38.2% recovery as happened here. Once the fourth wave was completed, we could have easily anticipated the end-points of the fifth wave as shown below.
 This concludes another valuable lesson on how to use Elliott Waves to anticipate market turns. Spend the time to learn the techniques taught in this blog and you will soon trade like a pro. Good luck.
Elliott Wave Analysis of IBM

Unleash your Potential
Transform your trading – Starting Today
