• About
  • Elliott Waves
    • Elliott Waves Explained
    • Elliott Wave Magic Illustrated with Wave Charts
    • Elliott Wave Edge – How Elliott Wave Traders Win
    • Fibonacci Number Series and Elliott Waves
    • How to use Fibonacci Ratio Retracements
    • Elliott Wave Books
      • The Elliott Wave Book – Five Waves to Financial Freedom
      • Dividend Growth Investing Using Elliott Waves
    • Videos
  • Equities
    • Indices
      • Africa
        • Egypt
      • Australia
      • European Indices
        • AEX – Index, Amsterdam
        • DAX Index
        • Istanbul
        • Russia
        • Spain’s IBEX 35
      • Asian Indices
        • India
        • China
        • Dubai
        • Kuwait
        • Kuala Lumpur
        • Pakistan
        • Saudi
        • Taiwan
      • US Indices
        • S&P500
        • Nasdaq
        • Dow Jones
        • Dow Jones Utilities
    • Stocks
      • Asian Stocks
        • Indian Stocks Trading
        • Dubai Stocks Outlook
        • Japanese Stocks
        • Kuwait stocks
        • Saudi Stocks Outlook
      • African Stocks
        • Egyptian Stocks
      • Swiss Stocks
      • Australian Stocks
      • European Stocks
      • US Stocks outlook
      • UK Stocks
  • Commodities
    • Copper
    • Gasoline
    • Gold
    • Natural Gas
    • Oil
    • Palm Oil
    • Raw Sugar
    • Rubber
    • Soybean Oil
    • Silver
  • Forex
    • AUD
    • Bitcoin
    • CAD
    • CHF
    • Euro
    • GBP
    • INR
    • NZD
    • JPY
  • Raves
  • Consulting
    • Consulting
  • Ramki’s Watchlist
Top News

Has Meta (Facebook) stock seen the bottom

March 21, 2022

What Is The Nearest Technical Support For Meta (NASDAQ: FB)

February 7, 2022

Using Elliott Waves to Capture a Trade in S&P500

January 27, 2022
Facebook Twitter Instagram
WaveTimes Blog WaveTimes Blog
Wave times
  • About
  • Elliott Waves
    • Elliott Waves Explained
    • Elliott Wave Magic Illustrated with Wave Charts
    • Elliott Wave Edge – How Elliott Wave Traders Win
    • Fibonacci Number Series and Elliott Waves
    • How to use Fibonacci Ratio Retracements
    • Elliott Wave Books
      • The Elliott Wave Book – Five Waves to Financial Freedom
      • Dividend Growth Investing Using Elliott Waves
    • Videos
  • Equities
    • Indices
      • Africa
        • Egypt
      • Australia
      • European Indices
        • AEX – Index, Amsterdam
        • DAX Index
        • Istanbul
        • Russia
        • Spain’s IBEX 35
      • Asian Indices
        • India
        • China
        • Dubai
        • Kuwait
        • Kuala Lumpur
        • Pakistan
        • Saudi
        • Taiwan
      • US Indices
        • S&P500
        • Nasdaq
        • Dow Jones
        • Dow Jones Utilities
    • Stocks
      • Asian Stocks
        • Indian Stocks Trading
        • Dubai Stocks Outlook
        • Japanese Stocks
        • Kuwait stocks
        • Saudi Stocks Outlook
      • African Stocks
        • Egyptian Stocks
      • Swiss Stocks
      • Australian Stocks
      • European Stocks
      • US Stocks outlook
      • UK Stocks
  • Commodities
    • Copper
    • Gasoline
    • Gold
    • Natural Gas
    • Oil
    • Palm Oil
    • Raw Sugar
    • Rubber
    • Soybean Oil
    • Silver
  • Forex
    • AUD
    • Bitcoin
    • CAD
    • CHF
    • Euro
    • GBP
    • INR
    • NZD
    • JPY
  • Raves
  • Consulting
    • Consulting
  • Ramki’s Watchlist
WaveTimes Blog WaveTimes Blog
Home » Elliott Wave update on Apple Inc (Nasdaq AAPL)
US Stocks outlook

Elliott Wave update on Apple Inc (Nasdaq AAPL)

RamkiBy RamkiNovember 15, 20117 Comments3 Mins Read
Facebook Twitter LinkedIn Telegram Pinterest Tumblr Reddit WhatsApp Email
Share
Facebook Twitter LinkedIn Pinterest Email

Elliott Wave analysis of Apple stock (Nasdaq AAPL) was posted in WaveTimes on 5th October, when we paid our tribute to the late Steeve Jobs. I remembered that post when I saw some rumors that Apple was asking for its production of iPads to be slowed down. The charts that you see here seems to vindicate the belief that there is considerable value in using Elliott Wave Principle for our investment and trading decisions. Take a look.
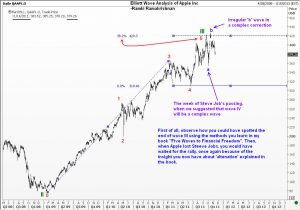
In the first chart, you will see the point ‘a’ is where we posted our previous analysis. At that time, we suggested that Wave III was already over, and we should expect wave IV to be a complex wave, meaning we will not go down directly, but there is a chance for a corrective pattern which will take us higher again. Sure enough, we were presented with an irregular B wave that went slightly higher than the top of wave III.
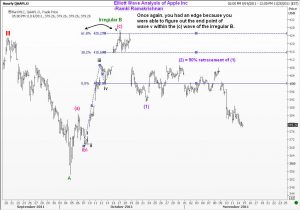
Could one have anticipated where the top of the irregular wave B will finish? Sure! Using the techniques that I have taught in the book “Five Waves to Financial Freedom” you could have identified a resistance very close to the actual top. This is illustrated in the second chart of Apple that you see here.

In addition, the chart shows you that when wave C of the complex correction started down, you could have used a 50% pull back (wave 2 of the big C wave) to initiate some fresh shorts. I am also giving you potential targets for the end of Wave IV.
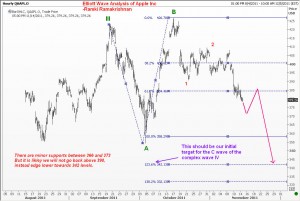
How confident can we be that it will work out again? Well, I have often maintained that in addition to solid analysis, you need to have sound money management techniques. I have said that we will probably not go above 390 now. So if you wish to have a low risk trade, you will probably wait for the fourth wave of the current C to take us slightly up and then sell. However, as always, you need to have a stop, because there are no guarantees in the market. We have a method that has worked over and over again. However, we also realize that one has to change tracks the moment something goes wrong. Elliott Wave analysis gives us a terrific edge in achieveing low-risk entry points and also identifying possible direction as well as extent of an impending move. What more can we ask for! In case you still have doubts, go back to the book and read the relevant sections. Good luck.

Share. Facebook Twitter Pinterest LinkedIn Tumblr Telegram Email
Previous ArticleElliottWave update on NSEI
Next Article Elliott Wave update on Gold 21 Nov 2011
Ramki
  • Website

Related Posts

Has Meta (Facebook) stock seen the bottom

March 21, 2022

What Is The Nearest Technical Support For Meta (NASDAQ: FB)

February 7, 2022

Hedge Funds and Elliott Waves – Netflix $NFLX

January 17, 2022
View 7 Comments

7 Comments

  1. Srinivasan on November 15, 2011 3:19 pm

    Mr. Ramki,

    I believe Apple may already have completed 5 waves or in an extended 5th wave. If you go all the way to 1997 you can notice that the 2000 .com crash created wave 2. the 2008/2009 subprime crash created wave 4 and is possibly in an extended wave 5 as shown in my attached chart.
    http://chart.ly/rp42xgr

    regards,
    -Srinivasan.

    Reply
    • Ramki on November 15, 2011 11:14 pm

      Hi Srini, Thanks for your comment. There are always many ways of counting a move, and we will not know which one is the right count until after the move. My preference, at the moment, is we are in a complex 4th wave.

      Reply
  2. VIJAY on February 12, 2012 4:14 am

    Dear Mr.Ramki.

    We are watching parabloic rise to almost 500 for aapl.

    How long this can continue or is this typical extneded 5 th to be corrected sharply to 380

    Reply
  3. Sachin on February 15, 2012 8:26 pm

    Hello Sir
    Apple has surely Topped yesterday(15th Feb) for the short term it seems, it has made a Bearish engulfing Pattern(A Bearish Reversal Bar with 4 times the Avg Volume) and the Rise from 365-400 has also been on Lower Volumes. Plz update Your view.Thanks
    Regards
    Sachin

    Reply
  4. Samstrader55 on March 18, 2012 3:24 pm

    Mr. Ramki,

    I recently bought your eBook and am reading through it. Good work. I am brand new to Elliot Waves. I was drawn to Elliot Waves and thereafter to your book after reading your EW analysis of Apple (AAPL). About two months ago, I thought I understood your analysis, but now I seem lost. Where do you think AAPL is now? It seems to be going up almost every day. Your valuable, educated input on this would be appreciated.

    Thanks and best regards,

    Sam.

    Reply
  5. Joe on May 6, 2013 8:55 pm

    How does the wave theory explain Apple now trading above 460?

    Reply
    • Ramki Ramakrishnan on May 7, 2013 8:54 pm

      Joe, I have posted another update on AAPL in Forbes today. Will publish the link tomorrow.

      Reply

Leave A Reply Cancel Reply

Recent Posts
  • Has Meta (Facebook) stock seen the bottom
  • What Is The Nearest Technical Support For Meta (NASDAQ: FB)
  • Using Elliott Waves to Capture a Trade in S&P500
  • Hedge Funds and Elliott Waves – Netflix $NFLX
  • When Elliott Waves applauds the promoter’s signals!

WaveTimes is a Research Organization dedicated to providing original analysis, reports, reviews, and insights on developments in mutual funds, stocks, investing, foreign exchange, commodities, and bonds.

Contact WaveTimes

L-601 Mantri Espana,

Kariyammana Agrahara, Bellandur, Bangalore 560103

Follow Us

  • Facebook
  • YouTube
  • Twitter

© 2022 Wave Times. All Rights Reserved.
  • About
  • Books
  • Privacy Policy
  • Policies and Standards

Type above and press Enter to search. Press Esc to cancel.