• About
  • Elliott Waves
    • Elliott Waves Explained
    • Elliott Wave Magic Illustrated with Wave Charts
    • Elliott Wave Edge – How Elliott Wave Traders Win
    • Fibonacci Number Series and Elliott Waves
    • How to use Fibonacci Ratio Retracements
    • Elliott Wave Books
      • The Elliott Wave Book – Five Waves to Financial Freedom
      • Dividend Growth Investing Using Elliott Waves
    • Videos
  • Equities
    • Indices
      • Africa
        • Egypt
      • Australia
      • European Indices
        • AEX – Index, Amsterdam
        • DAX Index
        • Istanbul
        • Russia
        • Spain’s IBEX 35
      • Asian Indices
        • India
        • China
        • Dubai
        • Kuwait
        • Kuala Lumpur
        • Pakistan
        • Saudi
        • Taiwan
      • US Indices
        • S&P500
        • Nasdaq
        • Dow Jones
        • Dow Jones Utilities
    • Stocks
      • Asian Stocks
        • Indian Stocks Trading
        • Dubai Stocks Outlook
        • Japanese Stocks
        • Kuwait stocks
        • Saudi Stocks Outlook
      • African Stocks
        • Egyptian Stocks
      • Swiss Stocks
      • Australian Stocks
      • European Stocks
      • US Stocks outlook
      • UK Stocks
  • Commodities
    • Copper
    • Gasoline
    • Gold
    • Natural Gas
    • Oil
    • Palm Oil
    • Raw Sugar
    • Rubber
    • Soybean Oil
    • Silver
  • Forex
    • AUD
    • Bitcoin
    • CAD
    • CHF
    • Euro
    • GBP
    • INR
    • NZD
    • JPY
  • Raves
  • Consulting
    • Consulting
  • Ramki’s Watchlist
Top News

Has Meta (Facebook) stock seen the bottom

March 21, 2022

What Is The Nearest Technical Support For Meta (NASDAQ: FB)

February 7, 2022

Using Elliott Waves to Capture a Trade in S&P500

January 27, 2022
Facebook Twitter Instagram
WaveTimes Blog WaveTimes Blog
Wave times
  • About
  • Elliott Waves
    • Elliott Waves Explained
    • Elliott Wave Magic Illustrated with Wave Charts
    • Elliott Wave Edge – How Elliott Wave Traders Win
    • Fibonacci Number Series and Elliott Waves
    • How to use Fibonacci Ratio Retracements
    • Elliott Wave Books
      • The Elliott Wave Book – Five Waves to Financial Freedom
      • Dividend Growth Investing Using Elliott Waves
    • Videos
  • Equities
    • Indices
      • Africa
        • Egypt
      • Australia
      • European Indices
        • AEX – Index, Amsterdam
        • DAX Index
        • Istanbul
        • Russia
        • Spain’s IBEX 35
      • Asian Indices
        • India
        • China
        • Dubai
        • Kuwait
        • Kuala Lumpur
        • Pakistan
        • Saudi
        • Taiwan
      • US Indices
        • S&P500
        • Nasdaq
        • Dow Jones
        • Dow Jones Utilities
    • Stocks
      • Asian Stocks
        • Indian Stocks Trading
        • Dubai Stocks Outlook
        • Japanese Stocks
        • Kuwait stocks
        • Saudi Stocks Outlook
      • African Stocks
        • Egyptian Stocks
      • Swiss Stocks
      • Australian Stocks
      • European Stocks
      • US Stocks outlook
      • UK Stocks
  • Commodities
    • Copper
    • Gasoline
    • Gold
    • Natural Gas
    • Oil
    • Palm Oil
    • Raw Sugar
    • Rubber
    • Soybean Oil
    • Silver
  • Forex
    • AUD
    • Bitcoin
    • CAD
    • CHF
    • Euro
    • GBP
    • INR
    • NZD
    • JPY
  • Raves
  • Consulting
    • Consulting
  • Ramki’s Watchlist
WaveTimes Blog WaveTimes Blog
Home » Elliott Wave Analysis of Sabic (Saudi Arabia)
Saudi Stocks Outlook

Elliott Wave Analysis of Sabic (Saudi Arabia)

RamkiBy RamkiMay 12, 20106 Comments1 Min Read
Facebook Twitter LinkedIn Telegram Pinterest Tumblr Reddit WhatsApp Email
Share
Facebook Twitter LinkedIn Pinterest Email

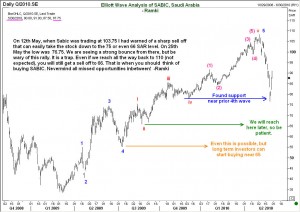
Here is the Elliott Wave Analysis of Saudi Basic Industries Corporation, or SABIC. Actually there are two charts that I would like you to see. The first is a monthly chart that shows the huge 5-wave rally to 252.61 has been corrected by a 3-wave decline. Wave B retraced Wave A by 61.8%, and then we got the unholy dump.

The second chart on the right shows not only the internal waves of Wave C, but more interestingly, the current rally from the lows. What I can see is an extended 5th wave. Now you all know how much I love a fifth wave extension, because fifth waves can make you rich. Go back and see the numerous examples of extended fifth waves in this blog and you will be amazed! Once we finish this fifth wave, I am looking for a sharp sell off that can easily take the stock of SABIC down to the 75 or even 66 Saudi Riyals level.  So be ready for that event.

Share. Facebook Twitter Pinterest LinkedIn Tumblr Telegram Email
Previous ArticleMedium Term Outlook for Sterling Pound GBP/USD
Next Article Elliott Wave Analysis of EMAR Dubai
Ramki
  • Website

Related Posts

Elliott Wave analysis of Saudi Stocks

July 18, 2011

Elliott Wave Analysis of Saudi Steel Pipes Comapny

April 11, 2011

Elliott Wave Analysis of SABIC (Saudi Arabia)

May 30, 2010
View 6 Comments

6 Comments

  1. katthy on May 13, 2010 5:28 am

    dear ramki I enjoyed your analysis very much, Thank you
    for your for your time

    Reply
  2. ADS on May 13, 2010 12:41 pm

    dear ramki I enjoyed your analysis very much, Thank you
    for your for your time

    Reply
  3. ah on May 29, 2010 10:28 pm

    Mr. Ramki, Sabic saw a strong selloff when oil prices started to drop reach 68 a barrel 2 weeks back and Sabic dropped to 76.75 taking all the profits it made earlier this year along with the index. Yesterday the Saudi market witnessed a very strong move up of 5.5% and Sabic made a huge move up to the limit up of 10% to close at 88 after reaching a drop previous week to 76.75 and as for volumes in general the volumes were big not seen for a long time.

    Appreciate your views.
    Thank you

    Reply
  4. Ramki on May 31, 2010 2:27 am

    Hello ‘ah’, Thanks for reminding me about SABIC. I have posted a new comment today on this stock.

    Reply
  5. Alhasan on September 25, 2011 9:19 am

    Thank you Mr.Ramki
    I like to work with Elliot Waves

    But I depend on my selftstudy so I face some confuse when I number the wave !
    so I woud like to give me head lines to number the wave by the correct way.

    thank you very mutch

    Reply
    • Ramki on September 25, 2011 12:16 pm

      Hi Hasan, as I have many friends in the arab world, an Arabic translation of my book will be ready in a few days, and i am sure you will be able to understand the EWP better once you read that edition. please tell your friends to be on the lookout for an announcement soon!

      Reply

Leave A Reply Cancel Reply

Recent Posts
  • Has Meta (Facebook) stock seen the bottom
  • What Is The Nearest Technical Support For Meta (NASDAQ: FB)
  • Using Elliott Waves to Capture a Trade in S&P500
  • Hedge Funds and Elliott Waves – Netflix $NFLX
  • When Elliott Waves applauds the promoter’s signals!

WaveTimes is a Research Organization dedicated to providing original analysis, reports, reviews, and insights on developments in mutual funds, stocks, investing, foreign exchange, commodities, and bonds.

Contact WaveTimes

L-601 Mantri Espana,

Kariyammana Agrahara, Bellandur, Bangalore 560103

Follow Us

  • Facebook
  • YouTube
  • Twitter

© 2023 Wave Times. All Rights Reserved.
  • About
  • Books
  • Privacy Policy
  • Policies and Standards

Type above and press Enter to search. Press Esc to cancel.